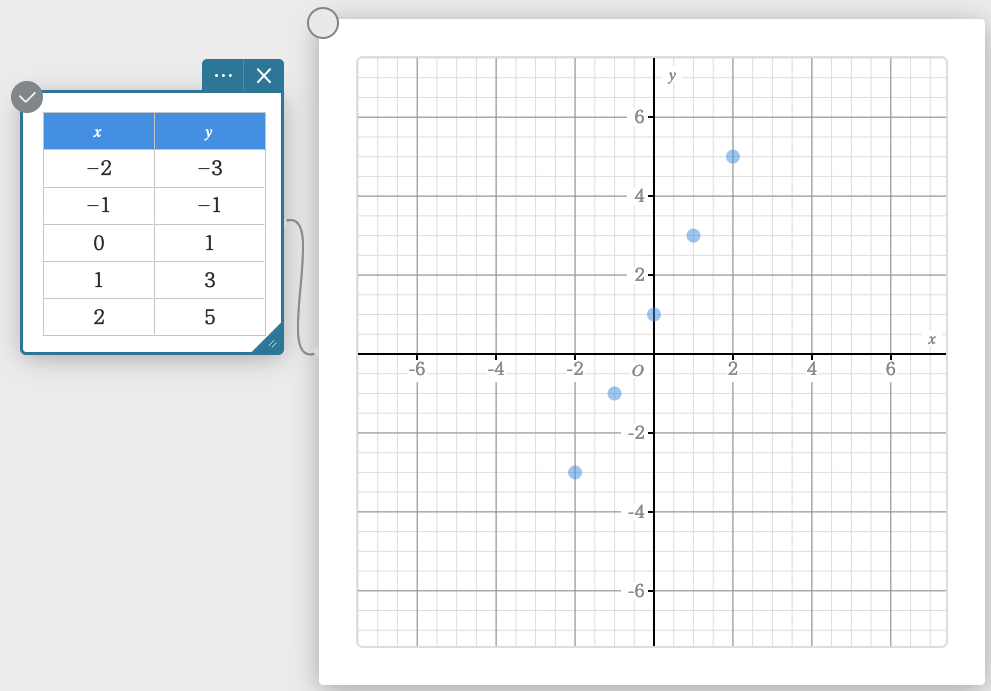
Create a graph from the table.
Step 1
To create a graph from a table, click anywhere in ClassPad to bring up the ClassPad menu. Select the Graphing tool in ClassPad.

Step 2
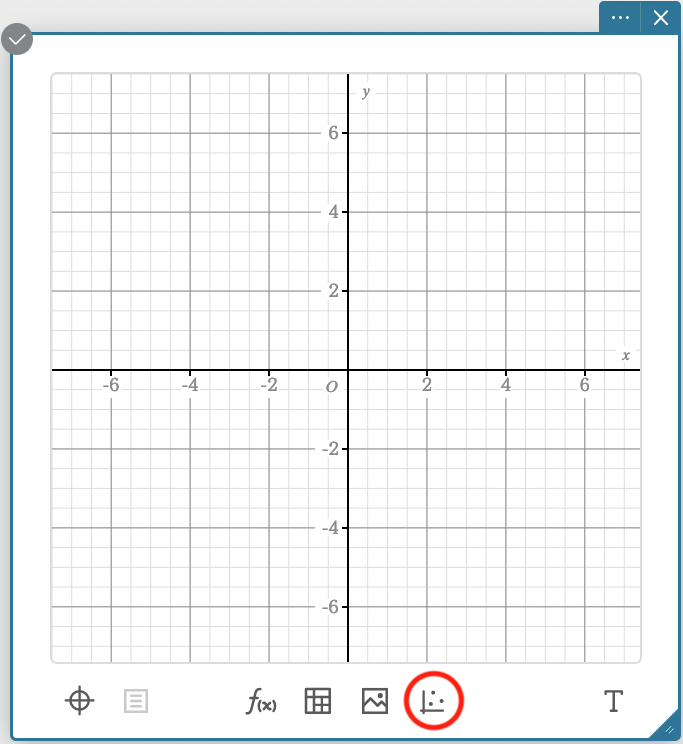
Select the Plot Points tool at the bottom of the graphing window.
Step 3
Enter the