Graph the following equation:
Step 1
Select the Graphing tool in ClassPad.
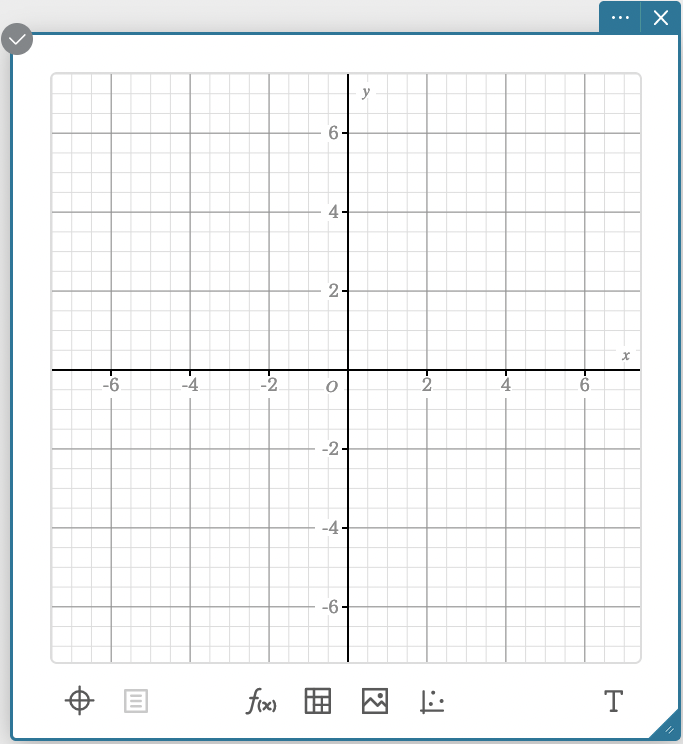
Step 2
Select the Graph Function tool at the bottom of the graphing window.
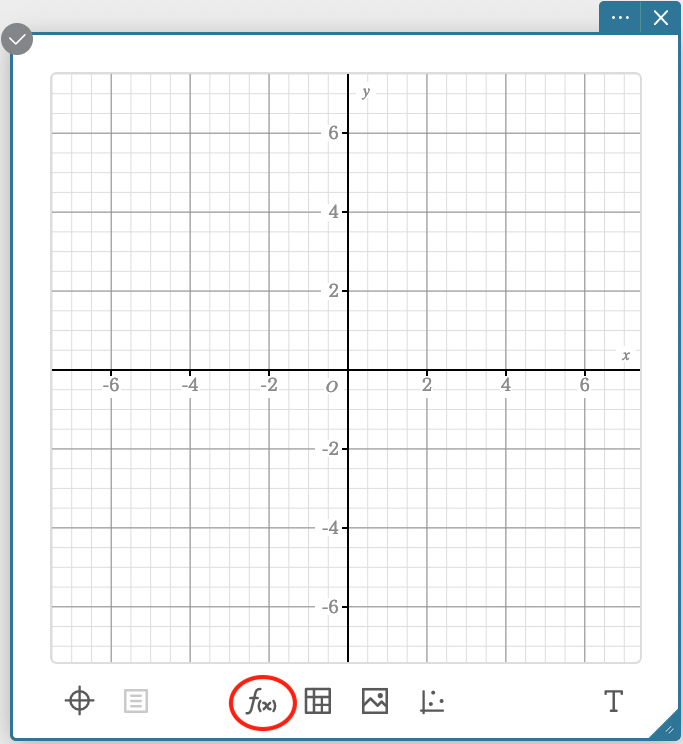
Step 3
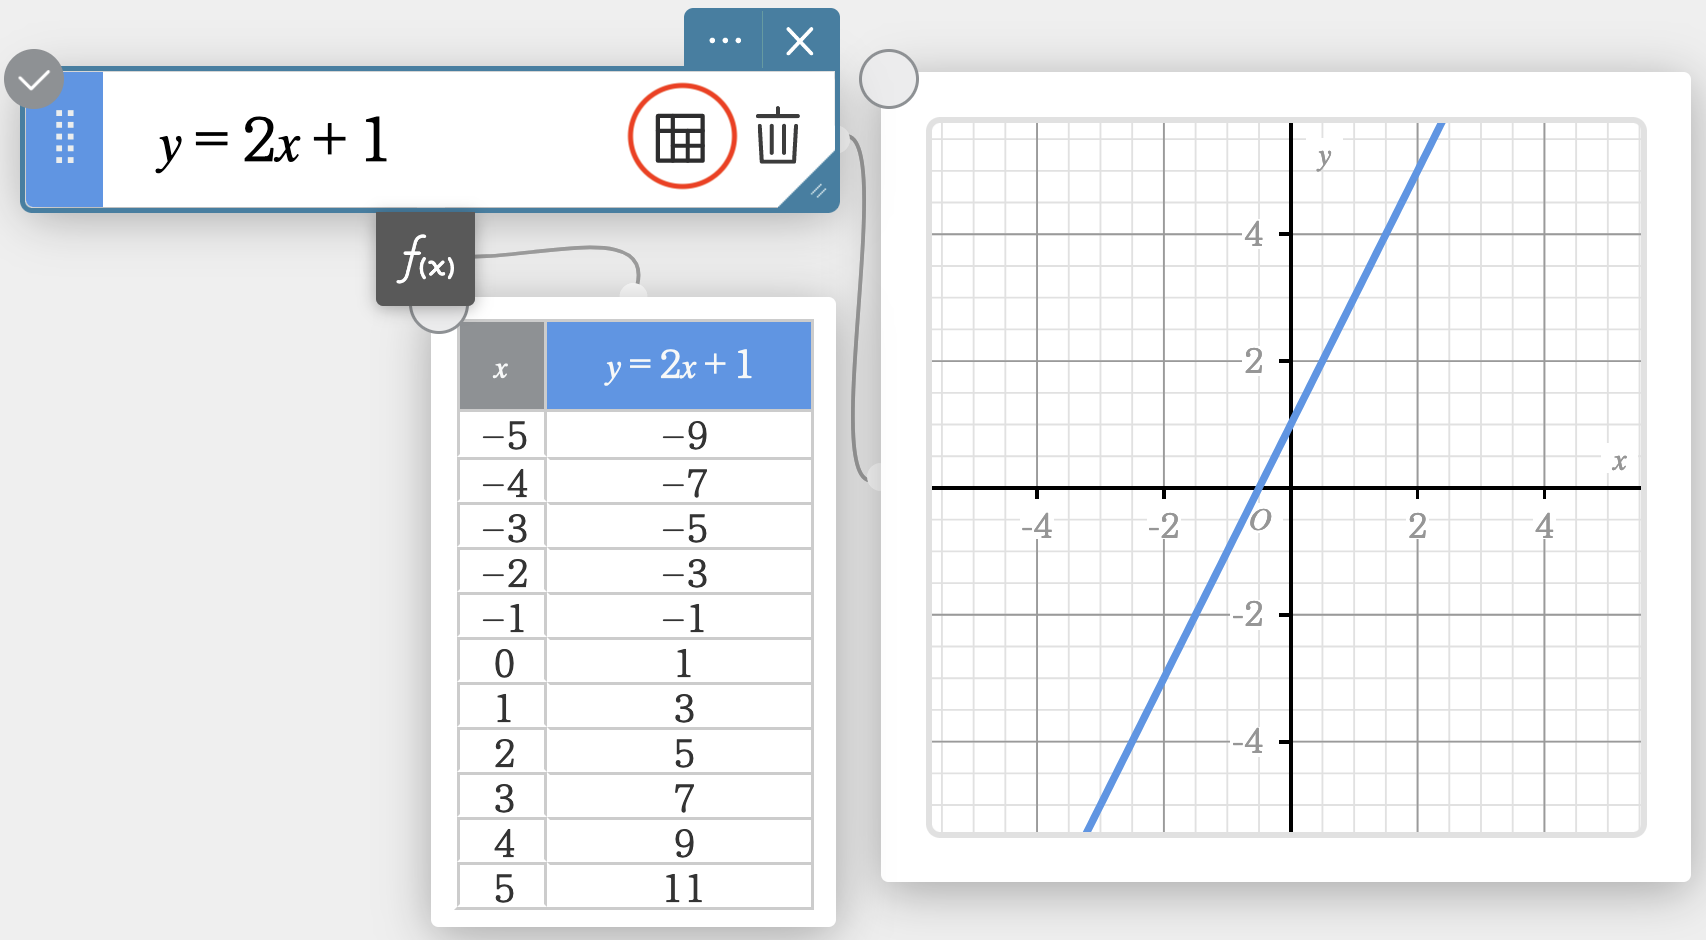
Enter the equation you want to graph into the function box. After you enter the equation and press enter, the graphed equation will appear.
Tip: You can also select Display Table in the function box to see values associated with the graphed equation.