Graph the equation
Step 1
To create a graph, click anywhere in ClassPad to bring up the ClassPad menu.
Select the Graphing Function tool in ClassPad.

Step 2
At the bottom of the graph, select the GRAPH FUNCTION tool.
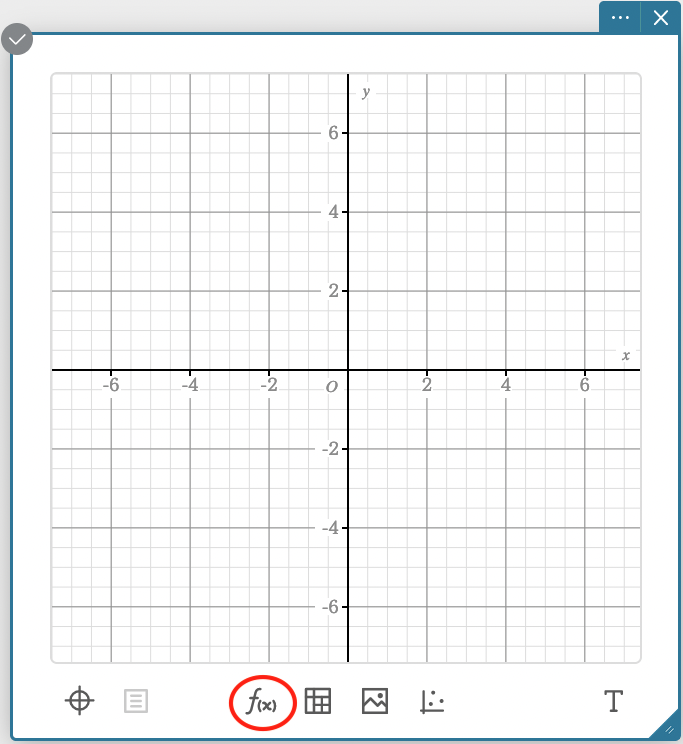
Step 3
Enter the equation in the box:
The graph will appear.
.png)