Parent function:
Predictions | |
|---|---|
Shifted right | |
Shifted down | |
Compressed by a scale of |
Step 1
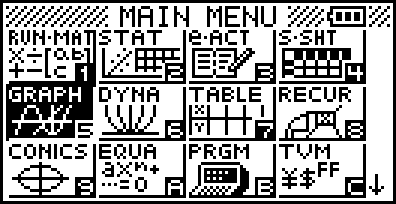
To compare the graph of the parent function to the graph of the transformed function, select MENU, then select GRAPH or press 5.
Step 2
Enter the parent function,
.png)
Step 3
Enter a transformed function on the next line.
.png)
Step 4
Click DRAW F6 to compare the graphs.
.png)