Compare
Step 1
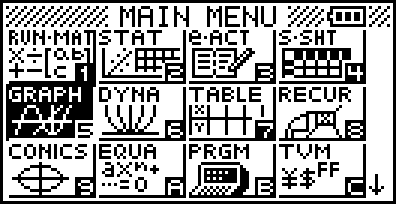
To compare the graphs of two lines from two inverse functions, select MENU, then select GRAPH or press 5.
Step 2
Enter each equation.
.png)
Step 3
Click DRAW F6 to see the lines.
.png)
Step 4
Open the table for the function by clicking MENU, then TABLE or 7
OR
Click on TABLE or F6 to open the table.
.png)
Step 5
Compare the input and output values. For example,
What can be said about the
.png)