In the same window, graph both of the following functions.
Step 1
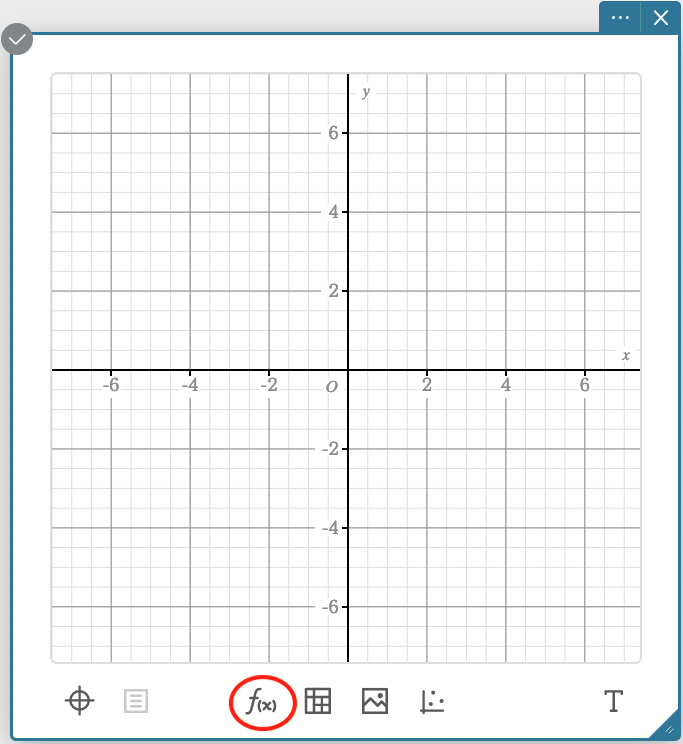
To compare the graphs of the two functions, click anywhere in ClassPad to bring up the ClassPad menu. Then select the graphing tool.

Step 2
Select the function tool to enter equations.
Step 3
Begin entering
Then click on Math, then 2.
.png)
Step 4
Select the piecewise bracket from the TOP row of the menu.
Fill in the piecewise function exactly as it is in the workbook. Pay careful attention to
.png)
Step 5
Click execute.
.png)
Step 6
To compare the piecewise graph with the absolute value graph, click the function icon and enter the absolute value function using the
Both
.png)
Step 7
To compare graphs, click on the colored bar on the left to show or hide the graph of the related equation.
.png)