In the same window, graph both of the following functions.
Step 1
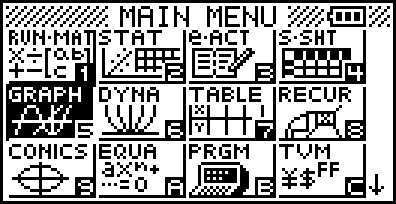
To compare the graphs of the two functions, select MENU, then select GRAPH or press 5.
Step 2
Enter each piecewise equation, followed by EXE.
Use a comma to separate the parameters from the equation and use brackets (Shift + -) to enter the parameters.
.png)
Step 3
To graph the absolute value function, click OPTN, then F6 until you can click on NUM then Abs.
.png)
Step 4
Enter the absolute value equation. Both
.png)
Step 5
Click EXE, then DRAW F6.
There is only one absolute value equation on the graph because the equations entered are coincident for
.png)
Step 6
To see graphs of the individual equations, click EXIT, then scroll and select SEL equations to show or hide them.
.png)
Step 7
View and compare graphs.
.png)