Graph
Step 1
To create a graph, click anywhere in ClassPad to bring up the ClassPad menu and select the GRAPHING tool.

Step 2
Select the GRAPH FUNCTION tool at the bottom of the graphing window to enter the inequality.
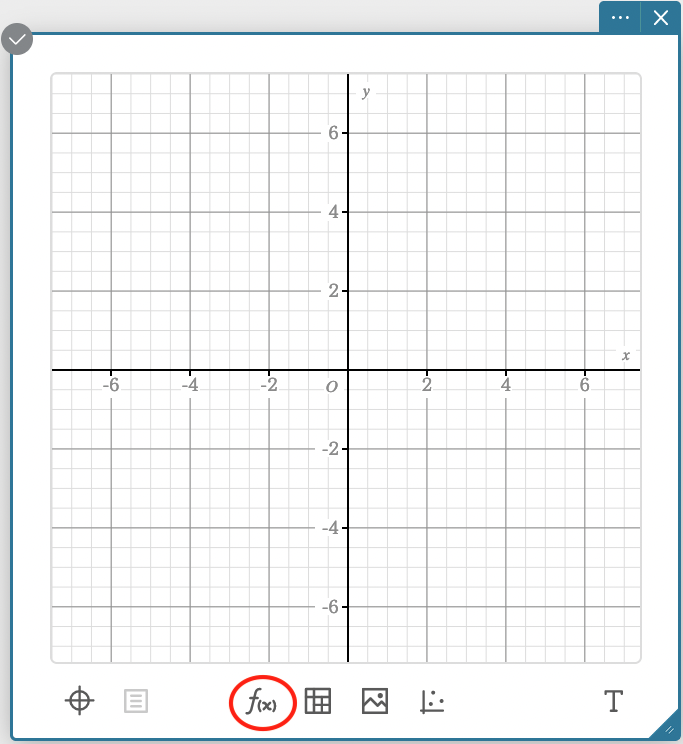
Step 3
Enter the inequality into the function box.
A graph will automatically be created on the coordinate plane.
.png)