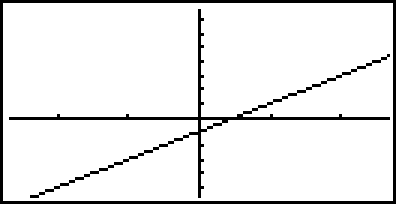
Graph the following equation:
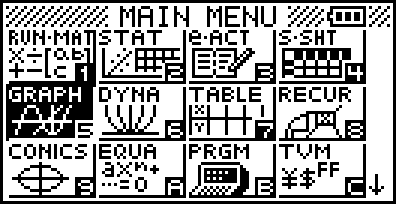
Step 1
From the Main Menu, Press 5 to enter the GRAPH Mode; GRAPH FUNC will appear first.
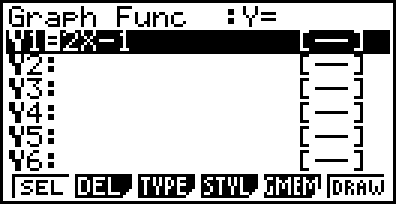
Step 2
Enter the equation after Y1= and then press EXE. Use the X, 𝜃,T button for the variable.
Step 3
Press F6 to DRAW (graph) your equation. Tip: Adjust the viewing window as needed by pressing SHIFT then F3.