If
Step 1
To create a graph, click anywhere in ClassPad to bring up the ClassPad menu.

Step 2
Select the Graph Function
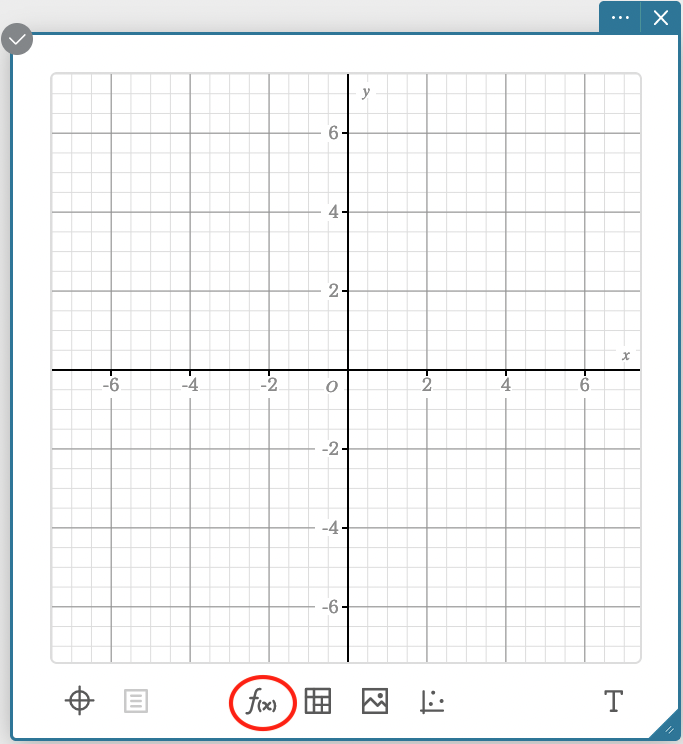
Step 3
Enter the two equations in the boxes and the graph will appear. One will be blue and the other will be red.
.png)
Step 4
You can click on the intersection points to see the coordinates.
.png)