Parent function:
Predictions | |
|---|---|
Shifted right | |
Shifted down | |
Compressed by a scale of |
Step 1
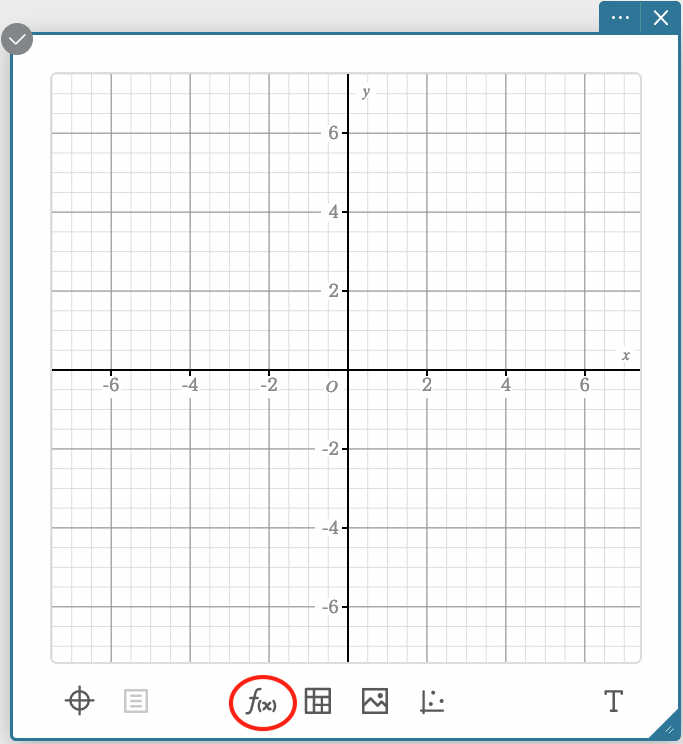
To compare the graph of the parent function to the graph of the transformed function, click anywhere in ClassPad to bring up the ClassPad menu. Then select the graphing tool.

Step 2
Select the function icon to enter the function.
Step 3
Enter the parent function and click Execute.
.png)
Step 4
Repeat steps 3 and 4 with each transformation function, and compare with your predictions.
.png)