Another option for understanding how changes in the numbers affect the graph of
Step 1
Start with a clean window. Click anywhere in ClassPad to bring up the ClassPad menu. Then, select the graphing tool.

Step 2
Select the function icon to enter the function.
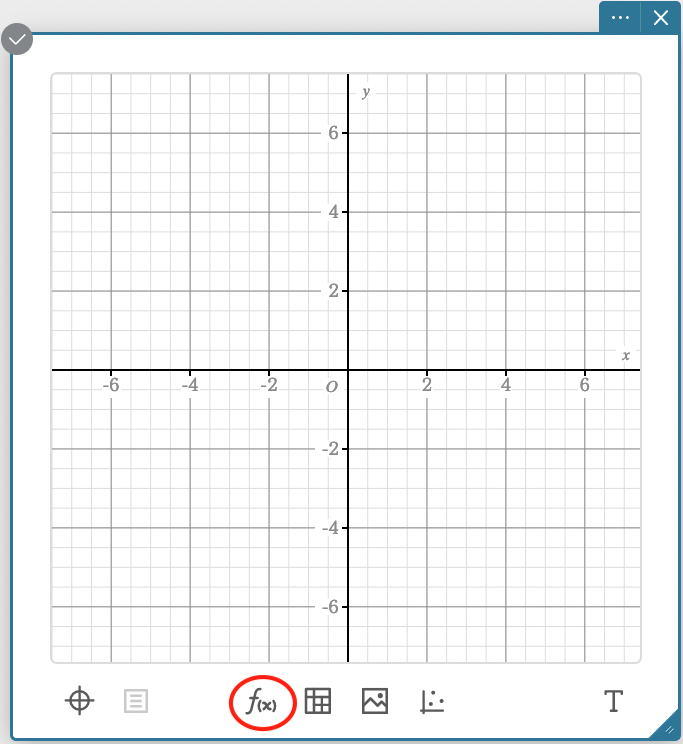
Step 3
Enter this equation in the function box:
.png)
Step 4
Drag the sliders to see how the parameters (variables
.png)