Compare
Step 1
To compare the graphs of two lines from two inverse functions, click anywhere in ClassPad to bring up the ClassPad menu. Then select the graphing tool.

Step 2
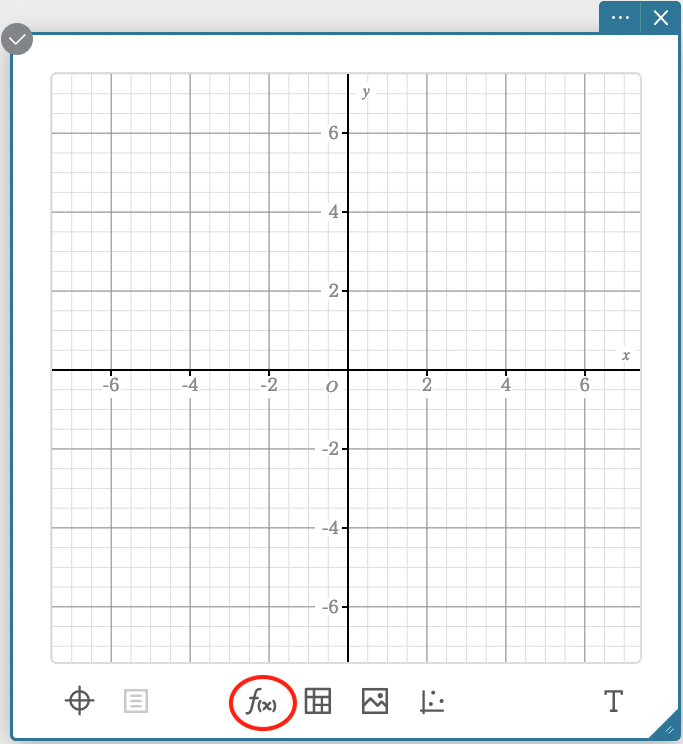
Select the function icon to enter the equations.
Step 3
Enter each equation and click Execute to see the lines.
.png)
Step 4
Access the tables.
.png)
Step 5
Compare the input and output values, for example
What can be said about the
.png)