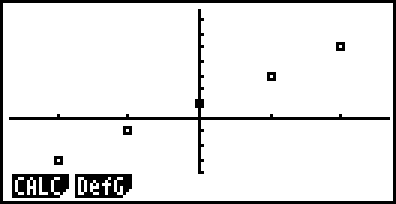
Create a graph from the table.
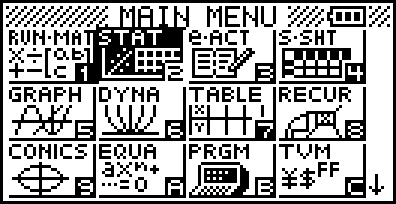
Step 1
From the Main Menu, Press 2 to enter the STAT mode; the “List Editor” will appear first.
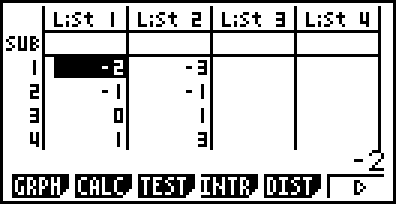
Step 2
You can use the List Editor to input your coordinates for graphing. Enter the
To input a value, press the value and then EXE to store it in the list. The calculator will automatically move to the next space below. To move to List 2, press the right arrow key.
Step 3
To graph the coordinates, press F1 to select GRPH.
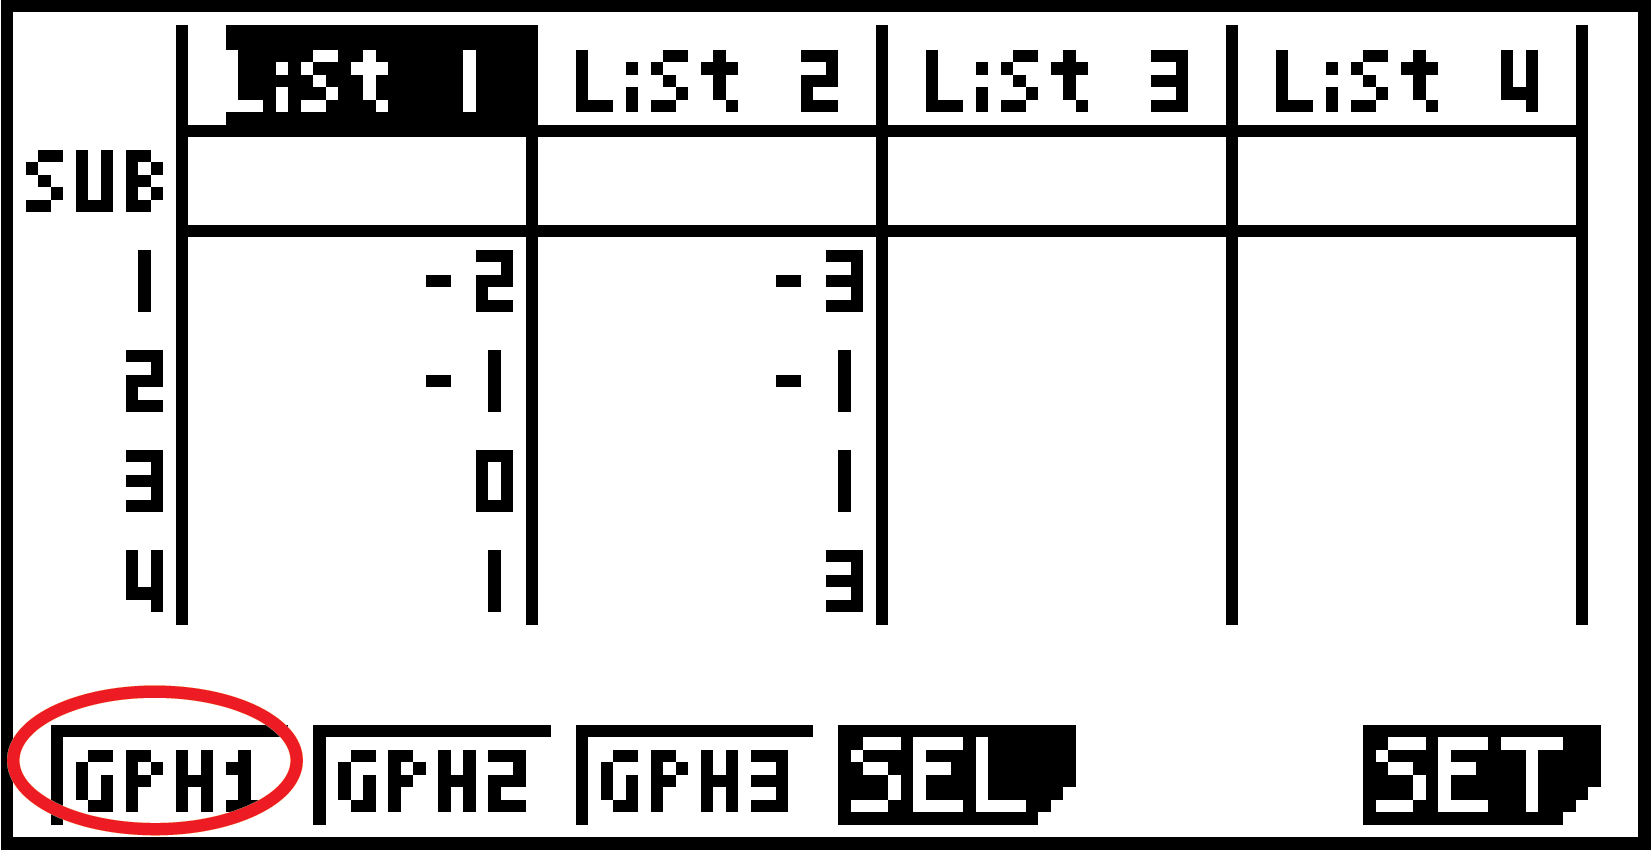
Step 4
Press F1 again to select GPH1 (Graph 1).