Lesson 12Percentages and Tape Diagrams
Let's use tape diagrams to understand percentages.
Learning Targets:
- I can use tape diagrams to solve different problems like “What is 40% of 60?” or “60 is 40% of what number?”
12.1 Notice and Wonder: Tape Diagrams
What do you notice? What do you wonder?

12.2 Revisiting Jada's Puppy
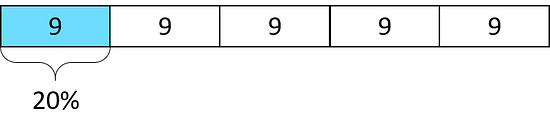
Jada has a new puppy that weighs 9 pounds. It is now at about 20% of its adult weight.
-
Here is a diagram that Jada drew about the weight of her puppy.
-
The adult weight of the puppy will be 45 pounds. How can you see that in the diagram?
-
What fraction of its adult weight is the puppy now? How can you see that in the diagram?
-
-
Jada’s friend has a dog that weighs 90 pounds. Here is a diagram Jada drew that represents the weight of her friend’s dog and the weight of her puppy.
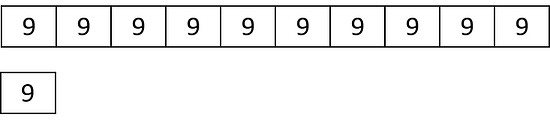
- How many times greater is the dog’s weight than the puppy’s?
- Compare the weight of the puppy and the dog using fractions.
- Compare the weight of the puppy and the dog using percentages.
12.3 5 Dollars
Noah has $5.
-
- Elena has 40% as much as Noah. How much does Elena have?
- Compare Elena’s and Noah’s money using fractions. Draw a diagram to illustrate.
-
- Diego has 150% as much as Noah. How much does Diego have?
- Compare Diego’s and Noah’s money using fractions. Draw a diagram to illustrate.
12.4 Staying Hydrated
During the first part of a hike, Andre drank 1.5 liters of the water he brought.
- If this is 50% of the water he brought, how much water did he bring?
- If he drank 80% of his water on his entire hike, how much did he drink?
Are you ready for more?
Decide if each scenario is possible.
- Andre plans to bring his dog on his next hike, along with 150% as much water as he brought on this hike.
- Andre plans to drink 150% of the water he brought on his hike.
Lesson 12 Summary
Tape diagrams can help us make sense of percentages.
Consider two problems that we solved earlier using double number lines and tables: “What is 30% of 50 pounds?” and “What is 100% of a number if 140% of it is 28?”
Here is a tape diagram that shows that 30% of 50 pounds is 15 pounds.

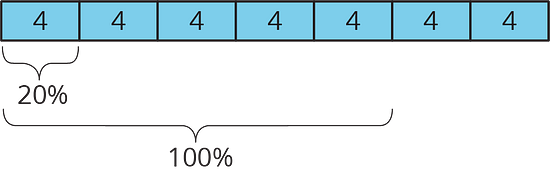
This diagram shows that if 140% of some number is 28, then that number must be 20.
Lesson 12 Practice Problems
Here is a tape diagram that shows how far two students walked.

- What percentage of Priya’s distance did Tyler walk?
- What percentage of Tyler’s distance did Priya walk?
A bakery makes 40 different flavors of muffins. 25% of the flavors have chocolate as one of the ingredients. Draw a tape diagram to show how many flavors have chocolate and how many don’t.
There are 70 students in the school band. 40% of them are sixth graders, 20% are seventh graders, and the rest are eighth graders.
- How many band members are sixth graders?
- How many band members are seventh graders?
- What percentage of the band members are eighth graders? Explain your reasoning.
Jada has a monthly budget for her cell phone bill. Last month she spent 120% of her budget, and the bill was $60. What is Jada’s monthly budget? Explain or show your reasoning.
Which is a better deal, 5 tickets for $12.50 or 8 tickets for $20.16? Explain your reasoning.
An athlete runs 8 miles in 50 minutes on a treadmill. At this rate:
- How long will it take the athlete to run 9 miles?
- How far can the athlete run in 1 hour?