Lesson 10Introducing Graphs of Proportional Relationships
Let’s see how graphs of proportional relationships differ from graphs of other relationships.
Learning Targets:
- I know that the graph of a proportional relationship lies on a line through .
10.1 Notice These Points
10.2 T-shirts for Sale
Some T-shirts cost $8 each.
-
Use the table to answer these questions.
- What does represent?
- What does represent?
- Is there a proportional relationship between and ?
1 8 2 16 3 24 4 32 5 40 6 48 - Plot the pairs in the table on the coordinate plane.
- What do you notice about the graph?
10.3 Matching Tables and Graphs
Your teacher will give you papers showing tables and graphs.
- Examine the graphs closely. What is the same and what is different about the graphs?
- Sort the graphs into categories of your choosing. Label each category. Be prepared to explain why you sorted the graphs the way you did.
-
Take turns with a partner to match a table with a graph.
- For each match you find, explain to your partner how you know it is a match.
- For each match your partner finds, listen carefully to their explanation. If you disagree, work to reach an agreement.
Pause here so your teacher can review your work.
- Trade places with another group. How are their categories the same as your group's categories? How are they different?
- Return to your original place. Discuss any changes you may wish to make to your categories based on what the other group did.
- Which of the relationships are proportional?
- What have you noticed about the graphs of proportional relationships? Do you think this will hold true for all graphs of proportional relationships?
Are you ready for more?
- All the graphs in this activity show points where both coordinates are positive. Would it make sense for any of them to have one or more coordinates that are negative?
- The equation of a proportional relationship is of the form , where is a positive number, and the graph is a line through . What would the graph look like if were a negative number?
Lesson 10 Summary
One way to represent a proportional relationship is with a graph. Here is a graph that represents different amounts that fit the situation, “Blueberries cost $6 per pound.”

Different points on the graph tell us, for example, that 2 pounds of blueberries cost $12, and 4.5 pounds of blueberries cost $27.
Sometimes it makes sense to connect the points with a line, and sometimes it doesn’t. We could buy, for example, 4.5 pounds of blueberries or 1.875 pounds of blueberries, so all the points in between the whole numbers make sense in the situation, so any point on the line is meaningful.
If the graph represented the cost for different numbers of sandwiches (instead of pounds of blueberries), it might not make sense to connect the points with a line, because it is often not possible to buy 4.5 sandwiches or 1.875 sandwiches. Even if only points make sense in the situation, though, sometimes we connect them with a line anyway to make the relationship easier to see.
Graphs that represent proportional relationships all have a few things in common:
- Points that satisfy the relationship lie on a straight line.
- The line that they lie on passes through the origin, .
Here are some graphs that do not represent proportional relationships:
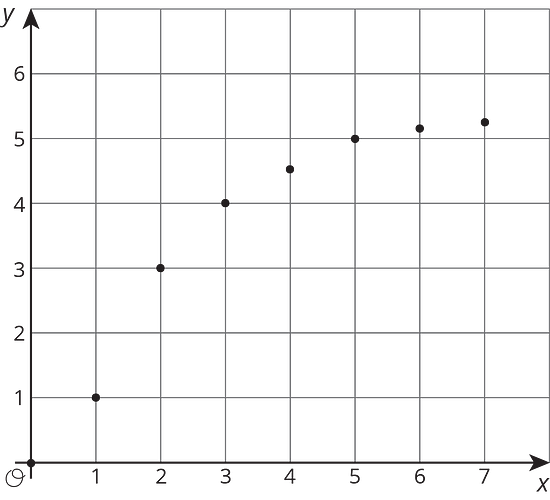
These points do not lie on a line.
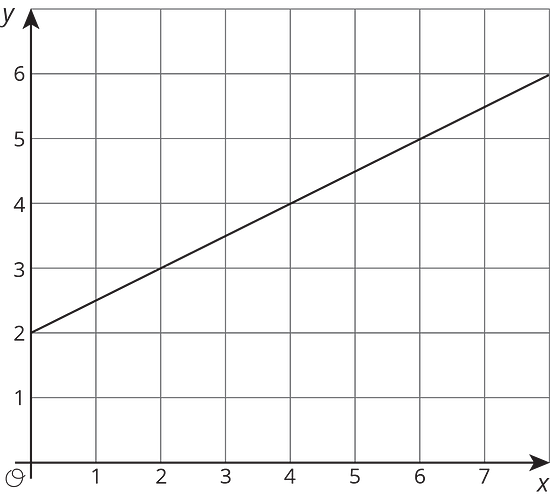
This is a line, but it doesn’t go through the origin.
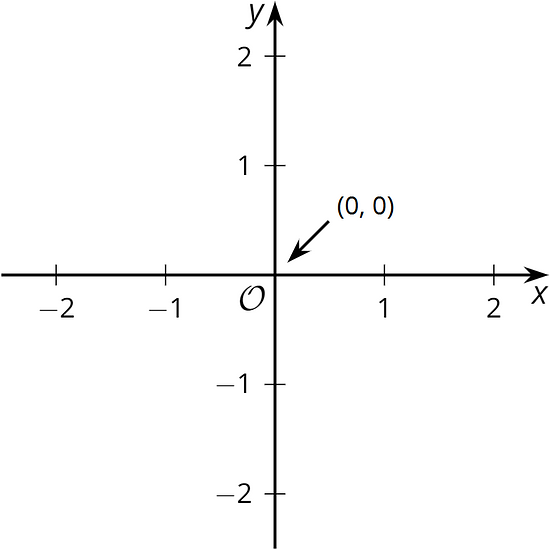
Glossary Terms
The origin is the point in the coordinate plane. This is where the horizontal axis and the vertical axis cross.
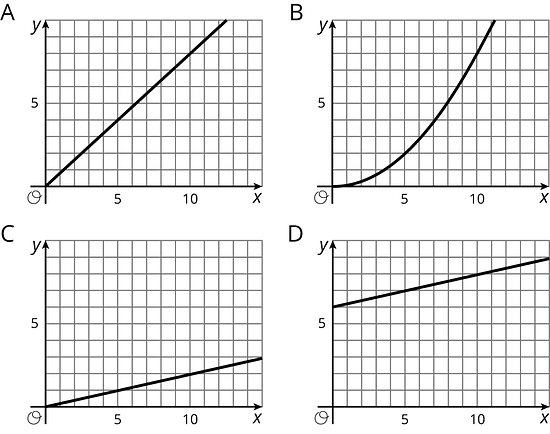
Lesson 10 Practice Problems
Which graphs could represent a proportional relationship? Explain how you decided.
A lemonade recipe calls for cup of lemon juice for every cup of water.
- Use the table to answer these questions.
- What does represent?
- What does represent?
- Is there a proportional relationship between and ?
- Plot the pairs in the table in a coordinate plane.
1 2 3 4 1 5 6 - Use the table to answer these questions.
Decide whether each table could represent a proportional relationship. If the relationship could be proportional, what would be the constant of proportionality?
-
The sizes you can print a photo:
width of photo (inches) height of photo (inches) 2 3 4 6 5 7 8 10 -
The distance from which a lighthouse is visible:
height of a lighthouse (feet) distance it can be seen (miles) 20 6 45 9 70 11 95 13 150 16
-
Select all of the pieces of information that would tell you and have a proportional relationship. Let represent the distance between a rock and a turtle's current position in meters and represent the number of minutes the turtle has been moving.
- After 4 minutes, the turtle has walked 12 feet away from the rock.
- The turtle walks for a bit, then stops for a minute before walking again.
- The turtle walks away from the rock at a constant rate.