Lesson 12Using Graphs to Compare Relationships
Let’s graph more than one relationship on the same grid.
Learning Targets:
- I can compare two related proportional relationships based on their graphs.
- I know that the steeper graph of two proportional relationships has a larger constant of proportionality.
12.1 Number Talk: Fraction Multiplication and Division
Find each product or quotient mentally.
12.2 Race to the Bumper Cars
Diego, Lin, and Mai went from the ticket booth to the bumper cars. Descriptions and tables representing their journeys are below.
1. Read each description and complete each table.
- Diego left the ticket booth at the same time as Tyler. Diego jogged ahead at a steady pace and reached the bumper cars in 30 seconds.
- Lin left the ticket booth at the same time as Tyler. She ran at a steady pace and arrived at the bumper cars in 20 seconds.
- Mai left the booth 10 seconds later than Tyler. Her steady jog enabled her to catch up with Tyler just as he arrived at the bumper cars.
| Diego's time (seconds) | Diego's distance (meters) |
|---|---|
| 0 | |
| 15 | |
| 30 | 50 |
| 1 |
| Lin's time (seconds) | Lin's distance (meters) |
|---|---|
| 0 | |
| 25 | |
| 20 | 50 |
| 1 |
| Mai's time (seconds) | Mai's distance (meters) |
|---|---|
| 0 | |
| 25 | |
| 40 | 50 |
| 1 |
2. Draw a graph for each person’s journey, including Tyler's (from before).
- Drag the names to the correct lines to label them.
- If you choose to, you can use the Paint Brush tool to change the color of each line. Select the tool, click on a color in the palette below the graph, and then click on a line. Click on the Move tool (the arrow) before changing to a new paint brush color.
- You can hide any points you create with the checkbox below the graph.
3. For Tyler, Diego, and Lin, which person is moving the most quickly? How is that reflected in the graph?
Are you ready for more?
Write equations to represent each person’s relationship between time and distance.
12.3 Space Rocks and the Price of Rope
-
Meteoroid Perseid 245 and an unknown asteroid were traveling through the solar system.
Explore the applet to learn about the distance they had each traveled after a given time.
Is Asteroid x traveling faster or slower than Perseid 245? Explain how you know.
-
The graph shows the price, , of different lengths, , of two types of rope.

If you buy $1.00 of each kind of rope, which one will be longer? Explain how you know.
Lesson 12 Summary
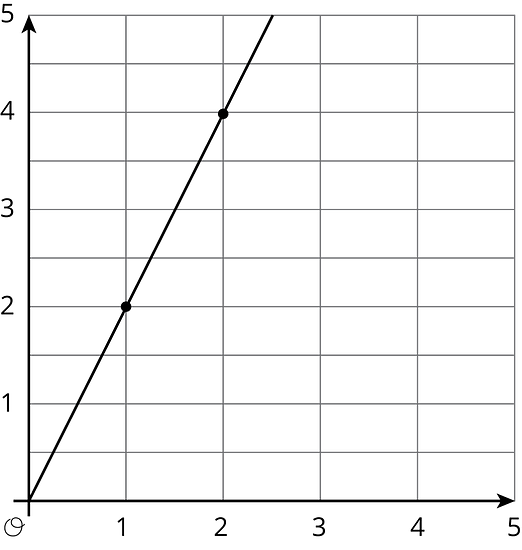
Here is a graph that shows the price of blueberries at two different stores. Which store has a better price?

We can compare points that have the same value or the same value. For example, the points and tell us that at store B you can get more pounds of blueberries for the same price.
The points and tell us that at store A you have to pay more for the same quantity of blueberries. This means store B has the better price.
We can also use the graphs to compare the constants of proportionality. The line representing store B goes through the point , so the constant of proportionality is 4. This tells us that at store B the blueberries cost $4 per pound. This is cheaper than the $6 per pound unit price at store A.
Lesson 12 Practice Problems
Match each equation to its graph.
1
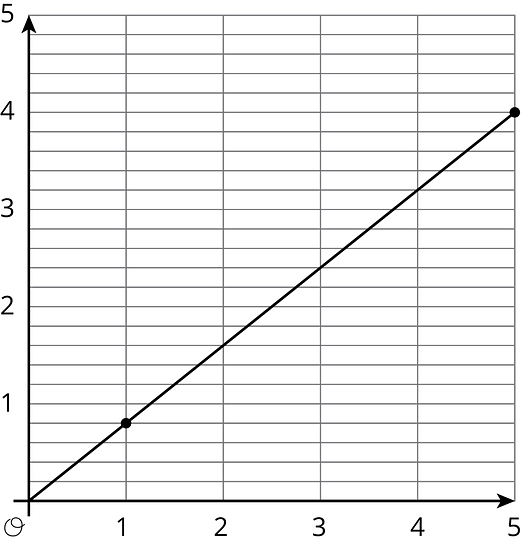
2
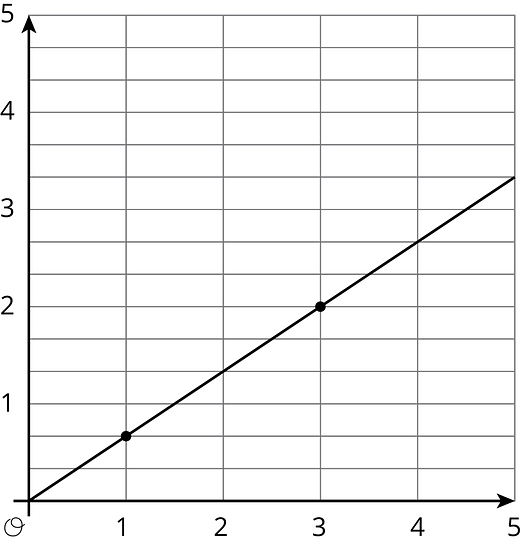
3
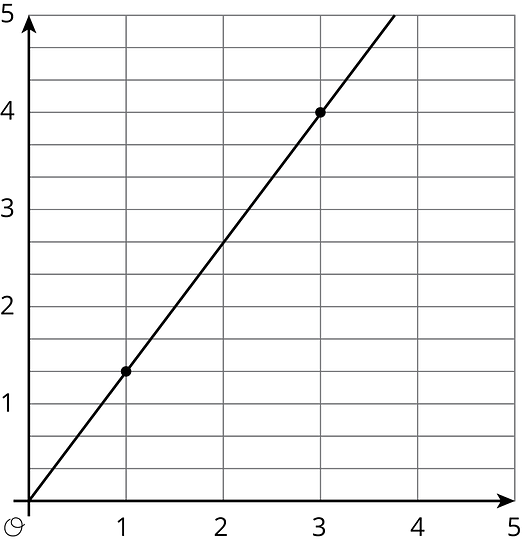
4
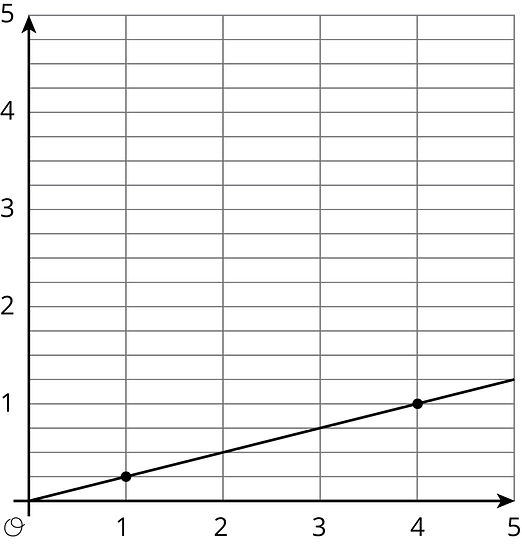
5
6

The graphs below show some data from a coffee shop menu. One of the graphs shows cost (in dollars) vs. drink volume (in ounces), and one of the graphs shows calories vs. drink volume (in ounces).
__________________ vs volume

_____________________ vs volume

- Which graph is which? Give them the correct titles.
- Which quantities appear to be in a proportional relationship? Explain how you know.
- For the proportional relationship, find the constant of proportionality. What does that number mean?
Lin and Andre biked home from school at a steady pace. Lin biked 1.5 km and it took her 5 minutes. Andre biked 2 km and it took him 8 minutes.
- Draw a graph with two lines that represent the bike rides of Lin and Andre.
- For each line, highlight the point with coordinates and find .
- Who was biking faster?