Lesson 3Reasoning about Contexts with Tape Diagrams (Part 2)
Let’s see how equations can describe tape diagrams.
Learning Targets:
- I can match equations and tape diagrams that represent the same situation.
- If I have an equation, I can draw a tape diagram that shows the same relationship.
3.1 Find Equivalent Expressions
Select all the expressions that are equivalent to . Explain how you know each expression you select is equivalent.
3.2 Matching Equations to Tape Diagrams
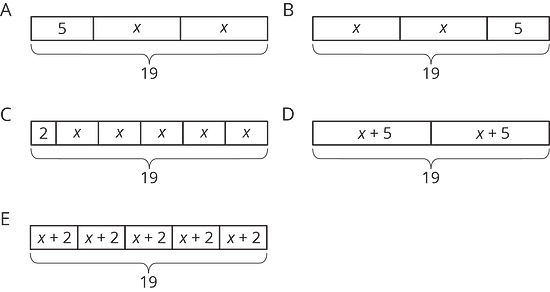
- Match each equation to one of the tape diagrams. Be prepared to explain how the equation matches the diagram.
- Sort the equations into categories of your choosing. Explain the criteria for each category.
3.3 Drawing Tape Diagrams to Represent Equations
-
Draw a tape diagram to match each equation.
-
Use any method to find values for and that make the equations true.
Are you ready for more?
To make a Koch snowflake:
- Start with an equilateral triangle that has side lengths of 1. This is step 1.
- Replace the middle third of each line segment with a small equilateral triangle with the middle third of the segment forming the base. This is step 2.
- Do the same to each of the line segments. This is step 3.
- Keep repeating this process.

- What is the perimeter after step 2? Step 3?
- What happens to the perimeter, or the length of line traced along the outside of the figure, as the process continues?
Lesson 3 Summary
We have seen how tape diagrams represent relationships between quantities. Because of the meaning and properties of addition and multiplication, more than one equation can often be used to represent a single tape diagram.
Let’s take a look at two tape diagrams.

We can describe this diagram with several different equations. Here are some of them:
- , because the parts add up to the whole.
- , because addition is commutative.
- , because if two quantities are equal, it doesn’t matter how we arrange them around the equal sign.
- , because one part (the part made up of 4 ’s) is the difference between the whole and the other part.

For this diagram:
- , because multiplication means having multiple groups of the same size.
- , because multiplication is commutative.
- , because division tells us the size of each equal part.
Lesson 3 Practice Problems
Solve each equation mentally.
Draw a tape diagram to match each equation.
-
Select all the equations that match the tape diagram.

Each car is traveling at a constant speed. Find the number of miles each car travels in 1 hour at the given rate.
-
135 miles in 3 hours
-
22 miles in hour
-
7.5 miles in hour
-
miles in hour
-
miles in hour
-