Lesson 10Representing Large Numbers on the Number Line
Let’s visualize large numbers on the number line using powers of 10.
Learning Targets:
- I can plot a multiple of a power of 10 on such a number line.
- I can subdivide and label a number line between 0 and a power of 10 with a positive exponent into 10 equal intervals.
- I can write a large number as a multiple of a power of 10.
10.1 Labeling Tick Marks on a Number Line
Label the tick marks on the number line. Be prepared to explain your reasoning.

10.2 Comparing Large Numbers with a Number Line
- Drag the points to their proper places on the number line. Be prepared to explain your reasoning.
-
Discuss with a partner how you decided where each point should go.
- Which is larger, 4,000,000 or ? Estimate how many times larger.
10.3 The Speeds of Light
The table shows how fast light waves or electricity can travel through different materials:
| material | speed of light (meters per second) |
|---|---|
| space | 300,000,000 |
| water | |
| copper wire (electricity) | 280,000,000 |
| diamond | |
| ice | |
| olive oil | 200,000,000 |
-
Which is faster, light through diamond or light through ice? How can you tell from the expressions for speed?
Let’s zoom in to highlight the values between and .
-
Plot a point for each speed on both number lines, and label it with the corresponding material.
-
There is one speed that you cannot plot on the bottom number line. Which is it? Plot it on the top number line instead.
- Which is faster, light through ice or light through diamond? How can you tell from the number line?
Are you ready for more?
- Find a four-digit number using only the digits 0, 1, 2, or 3 where:
- the first digit tells you how many zeros are in the number,
- the second digit tells you how many ones are in the number,
- the third digit tells you how many twos are in the number, and
- the fourth digit tells you how many threes are in the number.
The number 2,100 is close, but doesn’t quite work. The first digit is 2, and there are 2 zeros. The second digit is 1, and there is 1 one. The fourth digit is 0, and there are no threes. But the third digit, which is supposed to count the number of 2’s, is zero.
- Can you find more than one number like this?
- How many solutions are there to this problem? Explain or show your reasoning.
Lesson 10 Summary
There are many ways to compare two quantities. Suppose we want to compare the world population, about
7.4 billion
to the number of pennies the U.S. made in 2015, about
8,900,000,000
There are many ways to do this. We could write 7.4 billion as a decimal, 7,400,000,000, and then we can tell that there were more pennies made in 2015 than there are people in the world! Or we could use powers of 10 to write these numbers: for people in the world and for the number of pennies.
For a visual representation, we could plot these two numbers on a number line. We need to carefully choose our end points to make sure that the numbers can both be plotted. Since they both lie between and , if we make a number line with tick marks that increase by one billion, or , we start the number line with 0 and end it with , or . Here is a number line with the number of pennies and world population plotted:

Lesson 10 Practice Problems
Find three different ways to write the number 437,000 using powers of 10.
For each pair of numbers below, circle the number that is greater. Estimate how many times greater.
or
or
or
What number is represented by point ? Explain or show how you know.

Here is a scatter plot that shows the number of points and assists by a set of hockey players. Select all the following that describe the association in the scatter plot:

- Linear association
- Non-linear association
- Positive association
- Negative association
- No association
Here is the graph of days and the predicted number of hours of sunlight, , on the -th day of the year.
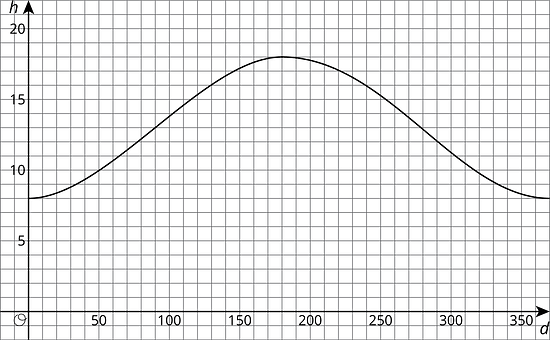
-
Is hours of sunlight a function of days of the year? Explain how you know.
-
For what days of the year is the number of hours of sunlight increasing? For what days of the year is the number of hours of sunlight decreasing?
-
Which day of the year has the greatest number of hours of sunlight?
-