Lesson 2Using Diagrams to Represent Addition and Subtraction
Let’s represent addition and subtraction of decimals.
Learning Targets:
- I can use diagrams to represent and reason about addition and subtraction of decimals.
- I can use place value to explain addition and subtraction of decimals.
- I can use vertical calculations to represent and reason about addition and subtraction of decimals.
2.1 Changing Values
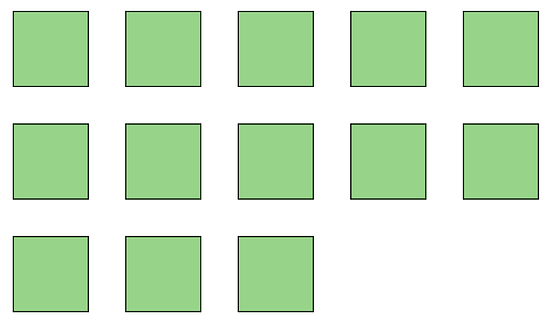
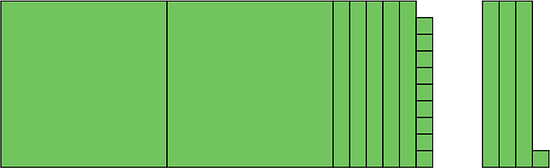
- Here is a rectangle.

What number does the rectangle represent if each small square represents:
-
1
-
0.1
-
0.01
-
0.001
-
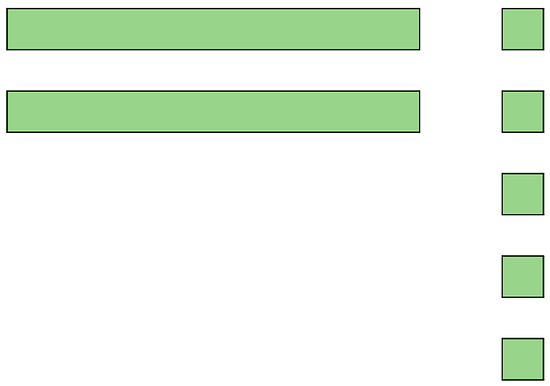
- Here is a square.

What number does the square represent if each small rectangle represents:
- 10
- 0.1
- 0.00001
2.2 Squares and Rectangles
You may be familiar with base-ten blocks that represent ones, tens, and hundreds. Here are some diagrams that we will use to represent digital base-ten units. A large square represents 1 one. A rectangle represents 1 tenth. A small square represents 1 hundredth.

The applet has tools that create each of the base-ten blocks.
Select a Block tool, and then click on the screen to place it.

One

Tenth

Hundredth

Click on the Move tool when you are done choosing blocks.
-
Here is the diagram that Priya drew to represent 0.13. Draw a different diagram that represents 0.13. Explain why your diagram and Priya’s diagram represent the same number.
-
Here is the diagram that Han drew to represent 0.25. Draw a different diagram that represents 0.25. Explain why your diagram and Han’s diagram represent the same number.
-
For each of these numbers, draw or describe two different diagrams that represent it.
a. 0.1 b. 0.02 c. 0.43 -
Use diagrams of base-ten units to represent the following sums and find their values. Think about how you could use as few units as possible to represent each number.
-
2.3 Finding Sums in Different Ways
-
Here are two ways to calculate the value of . In the diagram, each rectangle represents 0.1 and each square represents 0.01.

Use what you know about base-ten units and addition of base-ten numbers to explain:
-
Why ten squares can be “bundled” into a rectangle.
-
How this “bundling” is reflected in the computation.
The applet has tools that create each of the base-ten blocks. Select a Block tool, and then click on the screen to place it.
One
Tenth
Hundredth
Click on the Move tool when you are done choosing blocks.
-
-
Find the value of by drawing a diagram. Can you find the sum without bundling? Would it be useful to bundle some pieces? Explain your reasoning.
-
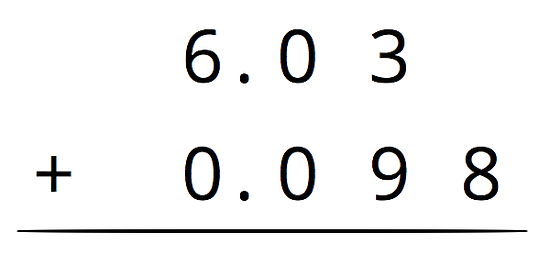
Calculate . Check your calculation against your diagram in the previous question.
-
Find each sum. The larger square represents 1, the rectangle represents 0.1, and the smaller square represents 0.01.
-
Are you ready for more?
A distant, magical land uses jewels for their bartering system. The jewels are valued and ranked in order of their rarity. Each jewel is worth 3 times the jewel immediately below it in the ranking. The ranking is red, orange, yellow, green, blue, indigo, and violet. So a red jewel is worth 3 orange jewels, a green jewel is worth 3 blue jewels, and so on.
-
If you had 500 violet jewels and wanted to trade so that you carried as few jewels as possible, which jewels would you have?
-
Suppose you have 1 orange jewel, 2 yellow jewels, and 1 indigo jewel. If you’re given 2 green jewels and 1 yellow jewels, what is the fewest number of jewels that could represent the value of the jewels you have?
2.4 Representing Subtraction
Here are the diagrams you used to represent ones, tenths, hundredths, thousandths, and ten-thousandths.

-
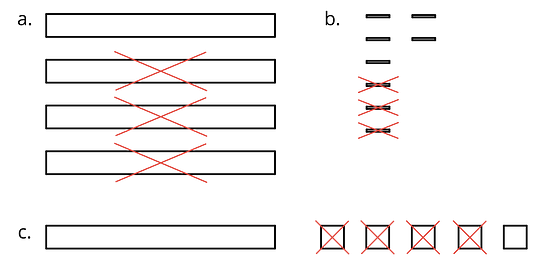
Here are diagrams that represent differences. Removed pieces are marked with Xs. For each diagram, write a numerical subtraction expression and determine the value of the expression.
-
Express each subtraction in words.
-
-
Find each difference by drawing a diagram and by calculating with numbers. Make sure the answers from both methods match. If not, check your diagram and your numerical calculation.
Lesson 2 Summary
Base-ten diagrams represent collections of base-ten units—tens, ones, tenths, hundredths, etc. We can use them to help us understand sums of decimals.
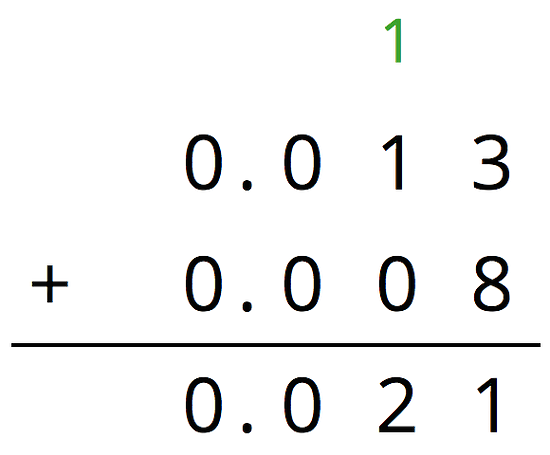
Here is a diagram of 0.008 and 0.013, where a square represents 0.001 and a rectangle (made up of ten squares) represents 0.01.

To find the sum, we can “bundle” (or compose) 10 thousandths as 1 hundredth.

Here is a diagram of the sum, which shows 2 hundredths and 1 thousandth.

We can use vertical calculation to find . Notice that here 10 thousandths are also bundled (or composed) as 1 hundredth.
Lesson 2 Practice Problems
Use the given key to answer the questions.

- What number does this diagram represent?

- Draw a diagram that represents 0.216.
- Draw a diagram that represents 0.304.
- What number does this diagram represent?
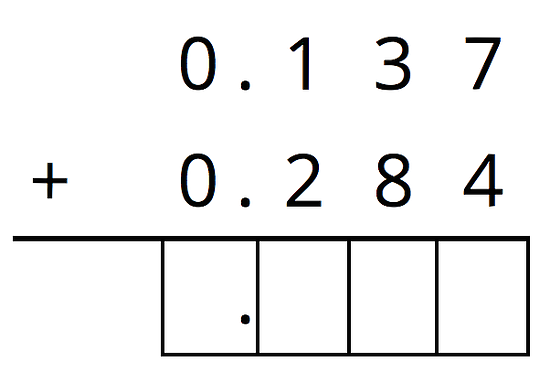
Here are diagrams that represent 0.137 and 0.284.

-
Use the diagram to find the value of . Explain your reasoning.
-
Calculate the sum vertically.
- How was your reasoning in the first two questions different? How was it similar or the same?
-
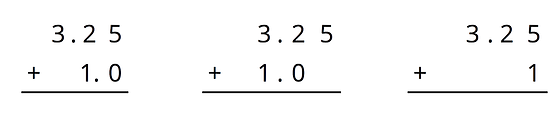
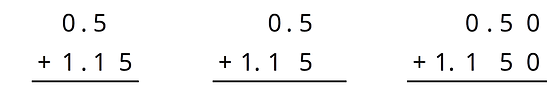
For the first two problems, circle the vertical calculation where digits of the same kind are lined up. Then, finish the calculation and find the sum. For the last two problems, find the sum using vertical calculation.
-
Andre has been practicing his math facts. He can now complete 135 multiplication facts in 90 seconds.
- If Andre is answering questions at a constant rate, how many facts can he answer per second?
- Noah also works at a constant rate, and he can complete 75 facts in 1 minute. Who is working faster? Explain or show your reasoning.