Lesson 14Four Representations
Let’s contrast relationships that are and are not proportional in four different ways.
Learning Targets:
- I can make connections between the graphs, tables, and equations of a proportional relationship.
- I can use units to help me understand information about proportional relationships.
14.1 Which is the Bluest?
- Which group of blocks is the bluest?
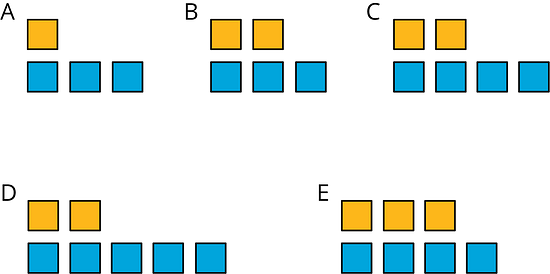
- Order the groups of blocks from least blue to bluest.
14.2 One Scenario, Four Representations
-
Select two things from different lists. Make up a situation where there is a proportional relationship between quantities that involve these things.
creatures
- starfish
- centipedes
- earthworms
- dinosaurs
length
- centimeters
- cubits
- kilometers
- parsecs
time
- nanoseconds
- minutes
- years
- millennia
volume
- milliliters
- gallons
- bushels
- cubic miles
body parts
- legs
- eyes
- neurons
- digits
area
- square microns
- acres
- hides
- square light-years
weight
- nanograms
- ounces
- deben
- metric tonnes
substance
- helium
- oobleck
- pitch
- glue
- Select two other things from the lists, and make up a situation where there is a relationship between quantities that involve these things, but the relationship is not proportional.
-
Your teacher will give you two copies of the “One Scenario, Four Representations” sheet. For each of your situations, describe the relationships in detail. If you get stuck, consider asking your teacher for a copy of the sample response.
- Write one or more sentences describing the relationship between the things you chose.
- Make a table with titles in each column and at least 6 pairs of numbers relating the two things.
- Graph the situation and label the axes.
- Write an equation showing the relationship and explain in your own words what each number and letter in your equation means.
- Explain how you know whether each relationship is proportional or not proportional. Give as many reasons as you can.
14.3 Make a Poster
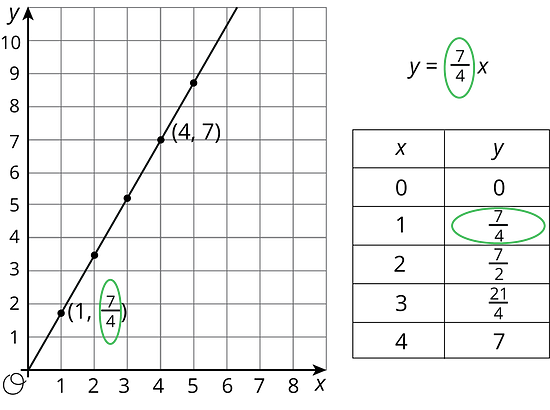
Lesson 14 Summary
The constant of proportionality for a proportional relationship can often be easily identified in a graph, a table, and an equation that represents it. Here is an example of all three representations for the same relationship. The constant of proportionality is circled:
On the other hand, some relationships are not proportional. If the graph of a relationship is not a straight line through the origin, if the equation cannot be expressed in the form , or if the table does not have a constant of proportionality that you can multiply by any number in the first column to get the associated number in the second column, then the relationship between the quantities is not a proportional relationship.
Lesson 14 Practice Problems
The equation shows how much it costs to buy gas at a gas station on a certain day. In the equation, represents the cost in dollars, and represents how many gallons of gas were purchased.
- Write down at least four (gallons of gas, cost) pairs that fit this relationship.
- Create a graph of the relationship.
- What does 2.95 represent in this situation?
- Jada’s mom remarks, “You can get about a third of a gallon of gas for a dollar.” Is she correct? How did she come up with that?
There is a proportional relationship between a volume measured in cups and the same volume measured in tablespoons. 3 cups is equivalent to 48 tablespoons, as shown in the graph.
- Plot and label at least two more points that represent the relationship.
- Use a straightedge to draw a line that represents this proportional relationship.
- For which value y is () on the line you just drew?
- What is the constant of proportionality for this relationship?
- Write an equation representing this relationship. Use for cups and for tablespoons.
