Lesson 2Graphs of Proportional Relationships
Let's think about scale.
Learning Targets:
- I can graph a proportional relationship from an equation.
- I can tell when two graphs are of the same proportional relationship even if the scales are different.
2.1 An Unknown Situation
Here is a graph that could represent a variety of different situations.
- Write an equation for the graph.
- Sketch a new graph of this relationship.
2.2 Card Sort: Proportional Relationships
Your teacher will give you 12 graphs of proportional relationships.
- Sort the graphs into groups based on what proportional relationship they represent.
- Write an equation for each different proportional relationship you find.
2.3 Different Scales
Two large water tanks are filling with water. Tank A is not filled at a constant rate, and the relationship between its volume of water and time is graphed on each set of axes. Tank B is filled at a constant rate of liters per minute. The relationship between its volume of water and time can be described by the equation , where is the time in minutes and is the total volume in liters of water in the tank.


- Sketch and label a graph of the relationship between the volume of water and time for Tank B on each of the axes.
- Answer the following questions and say which graph you used to find your answer.
- After 30 seconds, which tank has the most water?
- At approximately what times do both tanks have the same amount of water?
- At approximately what times do both tanks contain 1 liter of water? 20 liters?
Are you ready for more?
A giant tortoise travels at 0.17 miles per hour and an arctic hare travels at 37 miles per hour.
- Draw separate graphs that show the relationship between time elapsed, in hours, and distance traveled, in miles, for both the tortoise and the hare.
- Would it be helpful to try to put both graphs on the same pair of axes? Why or why not?
- The tortoise and the hare start out together and after half an hour the hare stops to take a rest. How long does it take the tortoise to catch up?
Lesson 2 Summary
The scales we choose when graphing a relationship often depend on what information we want to know. For example, say two water tanks are filled at different constant rates. The relationship between time in minutes and volume in liters of tank A is given by . For tank B the relationship is .
These equations tell us that tank A is being filled at a constant rate of 2.2 liters per minute and tank B is being filled at a constant rate of 2.75 liters per minute.
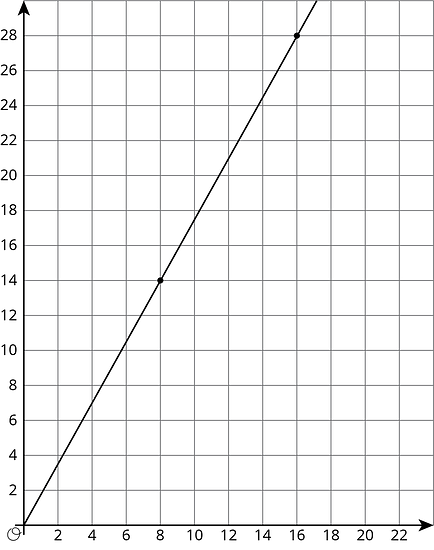
If we want to use graphs to see at what times the two tanks will have 110 liters of water, then using an axis scale from 0 to 10, as shown here, isn't very helpful.

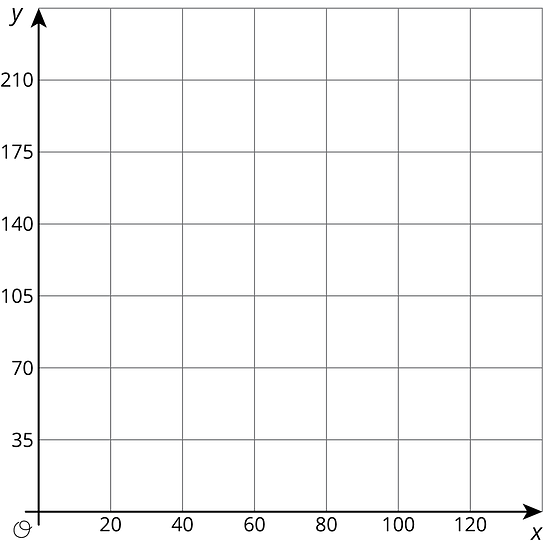
If we use a vertical scale that goes to 150 liters, a bit beyond the 110 we are looking for, and a horizontal scale that goes to 100 minutes, we get a much more useful set of axes for answering our question.

Now we can see that the two tanks will reach 110 liters 10 minutes apart—tank B after 40 minutes of filling and tank A after 50 minutes of filling.
It is important to note that both of these graphs are correct, but one uses a range of values that helps answer the question. In order to always pick a helpful scale, we should consider the situation and the questions asked about it.
Lesson 2 Practice Problems
The tortoise and the hare are having a race. After the hare runs 16 miles the tortoise has only run 4 miles.
The relationship between the distance the tortoise “runs” in miles for every miles the hare runs is . Graph this relationship.

The table shows a proportional relationship between the weight on a spring scale and the distance the spring has stretched.
- Complete the table.
- Describe the scales you could use on the and axes of a coordinate grid that would show all the distances and weights in the table.
distance (cm) weight (newtons) 20 28 55 140 1 Find a sequence of rotations, reflections, translations, and dilations showing that one figure is similar to the other. Be specific: give the amount and direction of a translation, a line of reflection, the center and angle of a rotation, and the center and scale factor of a dilation.

Consider the following dialogue:
Andre said, “I found two figures that are congruent, so they can’t be similar.”
Diego said, “No, they are similar! The scale factor is 1.”
Who is correct? Use the definition of similarity to explain your answer.