Lesson 8Linear Functions
Let’s investigate linear functions.
Learning Targets:
- I can determine whether a function is increasing or decreasing based on whether its rate of change is positive or negative.
- I can explain in my own words how the graph of a linear function relates to its rate of change and initial value.
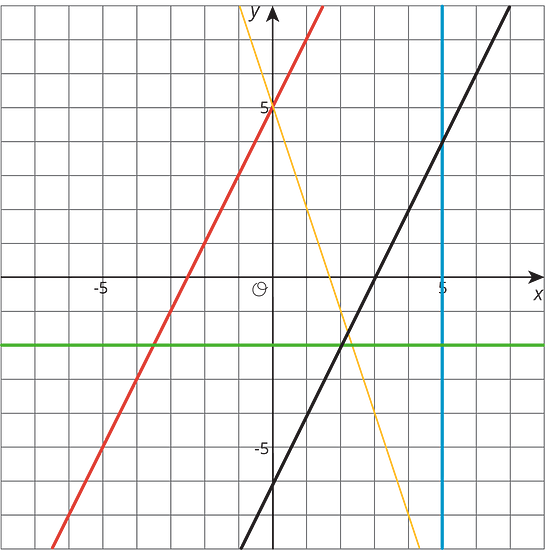
8.1 Bigger and Smaller
Diego said that these graphs are ordered from smallest to largest. Mai said they are ordered from largest to smallest. But these are graphs, not numbers! What do you think Diego and Mai are thinking?

8.2 Proportional Relationships Define Linear Functions
- Jada earns $7 per hour mowing her neighbors’ lawns.
- Name the two quantities in this situation that are in a functional relationship. Which did you choose to be the independent variable? What is the variable that depends on it?
- Write an equation that represents the function.
- Here is a graph of the function. Label the axes. Label at least two points with input-output pairs.

- To convert feet to yards, you multiply the number of feet by .
- Name the two quantities in this situation that are in a functional relationship. Which did you choose to be the independent variable? What is the variable that depends on it?
- Write an equation that represents the function.
- Draw the graph of the function. Label at least two points with input-output pairs.

8.3 Is it Filling Up or Draining Out?
There are four tanks of water. The amount of water in gallons, , in Tank A is given by the function , where is in minutes. The amount of water in gallons, , in Tank B starts at 400 gallons and is decreasing at 5 gallons per minute. These functions work when and .
- Which tank started out with more water?
- Write an equation representing the relationship between and .
- One tank is filling up. The other is draining out. Which is which? How can you tell?
- The amount of water in gallons, , in Tank C is given by the function . Is it filling up or draining out? Can you tell just by looking at the equation?
- The graph of the function for the amount of water in gallons, , in Tank D at time is shown. Is it filling up or draining out? How do you know?

Are you ready for more?
- Pick a tank that was draining out. How long did it take for that tank to drain? What percent full was the tank when 30% of that time had elapsed? When 70% of the time had elapsed?
- What point in the plane is 30% of the way from to ? 70% of the way?
- What point in the plane is 30% of the way from to ? 70% of the way?
8.4 Which is Growing Faster?
Noah is depositing money in his account every week to save money. The graph shows the amount he has saved as a function of time since he opened his account.
Elena opened an account the same day as Noah. The amount of money in her account is given by the function , where is the number of weeks since the account was opened.

- Who started out with more money in their account? Explain how you know.
- Who is saving money at a faster rate? Explain how you know.
- How much will Noah save over the course of a year if he does not make any withdrawals? How long will it take Elena to save that much?
Lesson 8 Summary
Suppose a car is traveling at 30 miles per hour. The relationship between the time in hours and the distance in miles is a proportional relationship. We can represent this relationship with an equation of the form , where distance is a function of time (since each input of time has exactly one output of distance). Or we could write the equation instead, where time is a function of distance (since each input of distance has exactly one output of time).
More generally, if we represent a linear function with an equation like , then is the initial value (which is 0 for proportional relationships), and is the rate of change of the function. If is positive, the function is increasing. If is negative, the function is decreasing. If we represent a linear function in a different way, say with a graph, we can use what we know about graphs of lines to find the and values and, if needed, write an equation.
Lesson 8 Practice Problems
Two cars drive on the same highway in the same direction. The graphs show the distance, , of each one as a function of time, . Which car drives faster? Explain how you know.

Two car services offer to pick you up and take you to your destination. Service A charges 40 cents to pick you up and 30 cents for each mile of your trip. Service B charges $1.10 to pick you up and charges cents for each mile of your trip.

- Match the services to the Lines and .
- For Service B, is the additional charge per mile greater or less than 30 cents per mile of the trip? Explain your reasoning.
Kiran and Clare like to race each other home from school. They run at the same speed, but Kiran's house is slightly closer to school than Clare's house. On a graph, their distance from their homes in meters is a function of the time from when they begin the race in seconds.
- As you read the graphs left to right, would the lines go up or down?
- What is different about the lines representing Kiran's run and Clare's run?
- What is the same about the lines representing Kiran's run and Clare's run?
Write an equation for each line.