Lesson 1What Influences Temperature?
Let’s see if we can predict the weather.
1.1 Temperature Changes
What factors or variables can influence the outside temperature?
-
Make a list of different factors.
-
Write a sentence for each factor describing how changing it could change the temperature.
1.2 Is Temperature a Function of Latitude?
-
Andre and Lin are wondering if temperature is a function of latitude.
Andre says, “I think it is, as long as we fix the time when we are measuring the temperature.”
Lin says, “But what if you have two places with the same latitude? Look at this weather map for Washington State. Seattle and Spokane have the same latitude but different temperatures right now.”What do Andre and Lin mean?
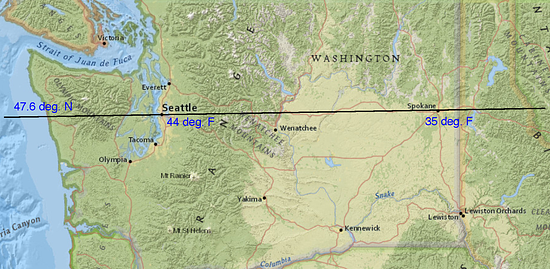
“Map of Washington” by United States Census Bureau via American Fact Finder. Public Domain. -
Andre and Lin are discussing whether it is possible to define latitude and temperature in a way that makes sense to talk about temperature as a function of latitude. They are considering different options. What are some advantages and disadvantages of each option?Here are the options:
-
Finding the temperature right now in cities with different latitudes.
-
Finding the daily high temperature at cities that have different latitudes.
-
Finding the average high temperature in a specific month, e.g., September, at cities that have different latitudes.
-
Finding the average yearly temperature at cities that have have different latitudes.
-
1.3 Is There an Association Between Latitude and Temperature?
Lin and Andre decided that modeling temperature as a function of latitude doesn’t really make sense. They realized that they can ask whether there is an association between latitude and temperature.
-
What information could they gather to determine whether temperature is related to latitude?
-
What should they do with that information to answer the question?
1.4 California Rain
What do you notice? What do you wonder?

1.5 Data Snooping
Examine the data in the table.
| city | latitude (degrees north) | average high temperature in September (degrees F) |
|---|---|---|
| Atlanta, GA | 33.38 | 82 |
| Portland, ME | 43.38 | 69 |
| Boston, MA | 42.22 | 73 |
| Dallas, TX | 32.51 | 88 |
| Denver, CO | 39.46 | 77 |
| Edmonton, AB | 53.34 | 62 |
| Fairbanks, AK | 64.48 | 55 |
| Juneau, AK | 58.22 | 56 |
| Kansas City, MO | 39.16 | 78 |
| Lincoln, NE | 40.51 | 77 |
| Miami, FL | 25.45 | 88 |
| Minneapolis, MN | 44.53 | 71 |
| New York City, NY | 40.38 | 75 |
| Orlando, FL | 28.26 | 90 |
| Philadelphia, PA | 39.53 | 78 |
| San Antonio, TX | 29.32 | 89 |
| San Francisco, CA | 37.37 | 74 |
| Seattle, WA | 47.36 | 69 |
| Tampa, FL | 27.57 | 89 |
| Tucson, AZ | 32.13 | 93 |
| Yellowknife, NT | 62.27 | 50 |
- What information does each row contain?
- What is the range for each variable?
- Do you see an association between the two variables? If so, describe the association.
1.6 Temperature vs. Latitude
-
Make a scatter plot of the data. Describe any patterns of association that you notice.

- Draw a line that fits the data. Write an equation for this line.
1.7 Using a Mathematical Model
In the previous activity, you found the equation of a line to represent the association between latitude and temperature. This is a mathematical model.
-
Use your model to predict the average high temperature in September at the following cities that were not included in the original data set:
-
Detroit (Lat: 42.14)
-
Albuquerque (Lat: 35.2)
-
Nome (Lat: 64.5)
-
Your own city (if available)
-
-
Draw points that represent the predicted temperatures for each city on the scatter plot.
- The actual average high temperature in September in these cities were:
-
Detroit: F
-
Albuquerque: F
-
Nome: F
-
Your own city (if available):
How well does you model predict the temperature? Compare the predicted and actual temperatures.
-
-
If you added the actual temperatures for these four cities to the scatter plot, would you move your line?
-
Are there any outliers in the data? What might be the explanation?
1.8 Interpreting a Mathematical Model
Refer to your equation for the line that models the association between latitude and temperature of the cities.
- What does the slope mean in the context of this situation?
- Find the vertical and horizontal intercepts and interpret them in the context of the situation.
- Can you think of a city or a location that could not be represented using this same model? Explain your thinking.