Lesson 6Increasing and Decreasing
Let’s use percentages to describe increases and decreases.
Learning Targets:
- I can draw a tape diagram that represents a percent increase or decrease.
- When I know a starting amount and the percent increase or decrease, I can find the new amount.
6.1 Improving Their Game
Here are the scores from 3 different sports teams from their last 2 games.
| sports team | total points in game 1 | total points in game 2 |
|---|---|---|
| football team | 22 | 30 |
| basketball team | 100 | 108 |
| baseball team | 4 | 12 |
- What do you notice about the teams’ scores? What do you wonder?
- Which team improved the most? Explain your reasoning.
6.2 More Cereal and a Discounted Shirt
- A cereal box says that now it contains 20% more. Originally, it came with 18.5 ounces of cereal. How much cereal does the box come with now?
- The price of a shirt is $18.50, but you have a coupon that lowers the price by 20%. What is the price of the shirt after using the coupon?

6.3 Using Tape Diagrams
-
Match each situation to a diagram. Be prepared to explain your reasoning.
- Compared with last year’s strawberry harvest, this year’s strawberry harvest is a 25% increase.
- This year’s blueberry harvest is 75% of last year’s.
- Compared with last year, this year’s peach harvest decreased 25%.
- This year’s plum harvest is 125% of last year’s plum harvest.


-
Draw a diagram to represent these situations.
- The number of ducks living at the pond increased by 40%.
- The number of mosquitoes decreased by 80%.
Are you ready for more?
What could it mean to say there is a 100% decrease in a quantity? Give an example of a quantity where this makes sense.
6.4 Agree or Disagree: Percentages
Do you agree or disagree with each statement? Explain your reasoning.
- Employee A gets a pay raise of 50%. Employee B gets a pay raise of 45%. So Employee A gets the bigger pay raise.
- Shirts are on sale for 20% off. You buy two of them. As you pay, the cashier says, “20% off of each shirt means 40% off of the total price.”
Lesson 6 Summary
Imagine that it takes Andre more than the time it takes Jada to get to school. Then we know that Andre’s time is or 1.75 times Jada’s time. We can also describe this in terms of percentages:

We say that Andre’s time is 75% more than Jada’s time. We can also see that Andre’s time is 175% of Jada’s time. In general, the terms percent increase and percent decrease describe an increase or decrease in a quantity as a percentage of the starting amount.
For example, if there were 500 grams of cereal in the original package, then “20% more” means that 20% of 500 grams has been added to the initial amount, , so there are 600 grams of cereal in the new package.
We can see that the new amount is 120% of the initial amount because

Glossary Terms
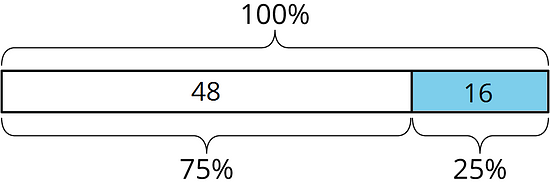
A percentage decrease tells how much a quantity went down, expressed as a percentage of the starting amount.
For example, a store had 64 hats in stock on Friday. The had 48 hats left on Saturday. The amount went down by 16.
This was a 25% decrease, because 16 is 25% of 64.
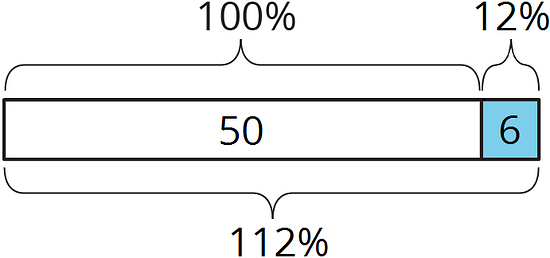
A percentage increase tell how much a quantity went up, expressed as a percentage of the starting amount.
For example, Elena had $50 in the bank on Monday. She had $56 on Tuesday. The amount went up by $6.
This was a 12% increase, because 6 is 12% of 50.
Lesson 6 Practice Problems
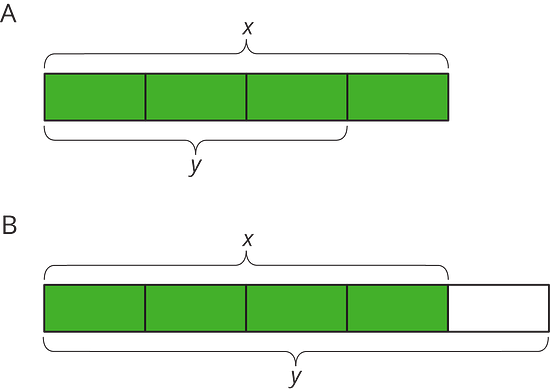
For each diagram, decide if is an increase or a decrease relative to . Then determine the percent increase or decrease.
Draw diagrams to represent the following situations.
- The amount of flour that the bakery used this month was a 40% increase relative to last month.
- The amount of milk that the bakery used this month was a 75% decrease relative to last month.
Write each percent increase or decrease as a percentage of the initial amount. The first one is done for you.
-
This year, there was 40% more snow than last year.
The amount of snow this year is 140% of the amount of snow last year.
- This year, there were 25% fewer sunny days than last year.
- Compared to last month, there was a 50% increase in the number of houses sold this month.
- The runner’s time to complete this marathon was 10% less than the time to complete the last marathon.
-
The graph shows the relationship between the diameter and the circumference of a circle with the point shown. Find 3 more points that are on the line.

Priya bought grams of flour. Clare bought more than that. Select all equations that represent the relationship between the amount of flour that Priya bought, , and the amount of flour that Clare bought, .
Here are recipes for two different banana cakes. Information for the first recipe is shown in the table.
sugar (cups) flour (cups) 3 The relationship between cups of flour and cups of sugar in the second recipe is
- If you used 4 cups of sugar, how much flour does each recipe need?
- What is the constant of proportionality for each situation and what does it mean?