Lesson 2More Linear Relationships
Let’s explore some more relationships between two variables.
Learning Targets:
- I can interpret the vertical intercept of a graph of a real-world situation.
- I can match graphs to the real-world situations they represent by identifying the slope and the vertical intercept.
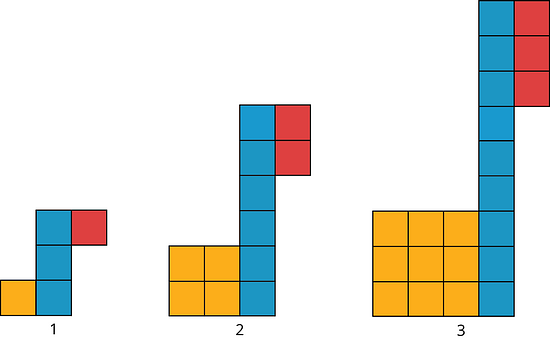
2.1 Growing
Look for a growing pattern. Describe the pattern you see.
-
If your pattern continues growing in the same way, how many tiles of each color will be in the 4th and 5th diagram? The 10th diagram?
-
How many tiles of each color will be in the th diagram? Be prepared to explain your reasoning.
2.2 Slopes, Vertical Intercepts, and Graphs
Your teacher will give you 6 cards describing different situations and 6 cards with graphs.
- Match each situation to a graph.
- Pick one proportional relationship and one non-proportional relationship and answer the following questions about them.
- How can you find the slope from the graph? Explain or show your reasoning.
- Explain what the slope means in the situation.
- Find the point where the line crosses the vertical axis. What does that point tell you about the situation?
2.3 Summer Reading
Lin has a summer reading assignment. After reading the first 30 pages of the book, she plans to read 40 pages each day until she finishes. Lin makes the graph shown here to track how many total pages she'll read over the next few days.
After day 1, Lin reaches page 70, which matches the point she made on her graph. After day 4, Lin reaches page 190, which does not match the point she made on her graph. Lin is not sure what went wrong since she knows she followed her reading plan.

- Sketch a line showing Lin's original plan on the axes.
-
What does the vertical intercept mean in this situation? How do the vertical intercepts of the two lines compare?
-
What does the slope mean in this situation? How do the slopes of the two lines compare?
Are you ready for more?
Jada's grandparents started a savings account for her in 2010. The table shows the amount in the account each year.
| year | amount in dollars |
|---|---|
| 2010 | 600 |
| 2012 | 750 |
| 2014 | 900 |
| 2016 | 1050 |
Lesson 2 Summary
At the start of summer break, Jada and Lin decide to save some of the money they earn helping out their neighbors to use during the school year. Jada starts by putting $20 into a savings jar in her room and plans to save $10 a week. Lin starts by putting $10 into a savings jar in her room plans to save $20 a week. Here are graphs of how much money they will save after 10 weeks if they each follow their plans:

The value where a line intersects the vertical axis is called the vertical intercept. When the vertical axis is labeled with a variable like , this value is also often called the -intercept. Jada's graph has a vertical intercept of $20 while Lin's graph has a vertical intercept of $10. These values reflect the amount of money they each started with. At 1 week they will have saved the same amount, $30. But after week 1, Lin is saving more money per week (so she has a larger rate of change), so she will end up saving more money over the summer if they each follow their plans.
Glossary Terms
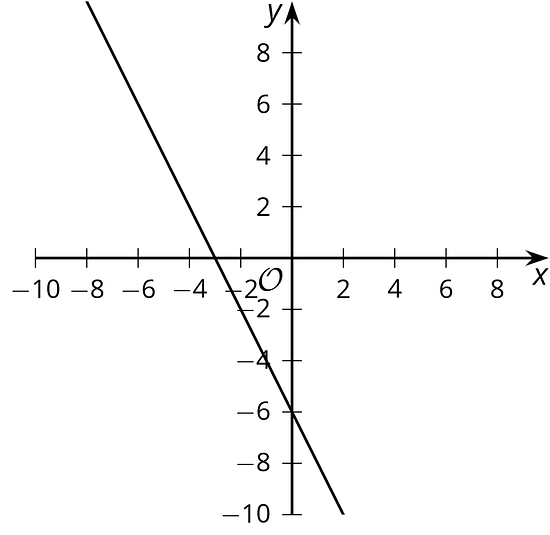
The vertical intercept is the point where the graph of a line crosses the vertical axis.
The vertical intercept of this line is or just -6.
Lesson 2 Practice Problems
Explain what the slope and intercept mean in each situation.
- A graph represents the perimeter, , in units, for an equilateral triangle with side length units. The slope of the line is 3 and the -intercept is 0.
- The amount of money, , in a cash box after tickets are purchased for carnival games. The slope of the line is and the -intercept is 8.
- The number of chapters read, , after days. The slope of the line is and the -intercept is 2.
- The graph shows the cost in dollars, , of a muffin delivery and the number of muffins, , ordered. The slope of the line is 2 and the -intercept is 3.
Customers at the gym pay a membership fee to join and then a fee for each class they attend. Here is a graph that represents the situation.
- What does the slope of the line shown by the points mean in this situation?
- What does the vertical intercept mean in this situation?

Find a sequence of rotations, reflections, translations, and dilations showing that one figure is similar to the other. Be specific: give the amount and direction of a translation, a line of reflection, the center and angle of a rotation, and the center and scale factor of a dilation.

Consider the following dialogue:
Andre said, “I found two figures that are congruent, so they can’t be similar.”
Diego said, “No, they are similar! The scale factor is 1.”
Who is correct? Use the definition of similarity to explain your answer.