Lesson 3Representations of Linear Relationships
Let’s write equations from real situations.
Learning Targets:
- I can use patterns to write a linear equation to represent a situation.
- I can write an equation for the relationship between the total volume in a graduated cylinder and the number of objects added to the graduated cylinder.
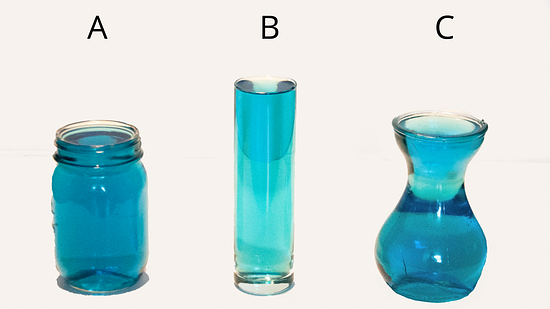
3.1 Estimation: Which Holds More?
Which glass will hold the most water? The least?
3.2 Rising Water Levels
Move the green circle to set the starting level of water to a value you or your teacher choose.
- What is the volume, , in the cylinder after you add:
- 3 objects?
- 7 objects?
- objects? Explain your reasoning.
-
If you wanted to make the water reach the highest mark on the cylinder, how many objects would you need?
-
Plot and label points that show your measurements from the experiment.
-
Plot and label a point that shows the depth of the water before you added any objects.
-
The points should fall on a line. Use a ruler to graph this line.
-
Compute the slope of the line using several different triangles. Does it matter which triangle you use to compute the slope? Why or why not?
-
The equation of the line in the experiment has two numbers and two variables. What physical quantities do the two numbers represent? What does represent and what does represent?
Are you ready for more?
A situation is represented by the equation .
-
Invent a story for this situation.
-
Graph the equation.
-
What do the and the 5 represent in your situation?
-
Where do you see the and 5 on the graph?
3.3 Calculate the Slope

- For each graph, record:
vertical change horizontal change slope -
Describe a procedure for finding the slope between any two points on a line.
-
Write an expression for the slope of the line in the graph using the letters and .
Lesson 3 Summary
Let's say we have a glass cylinder filled with 50 ml of water and a bunch of marbles that are 3 ml in volume. If we drop marbles into the cylinder one at a time, we can watch the height of the water increase by the same amount, 3 ml, for each one added. This constant rate of change means there is a linear relationship between the number of marbles and the height of the water. Add one marble, the water height goes up 3 ml. Add 2 marbles, the water height goes up 6 ml. Add marbles, the water height goes up ml.
Reasoning this way, we can calculate that the height, , of the water for marbles is . Any linear relationships can be expressed in the form using just the rate of change, , and the initial amount, . The 3 represents the rate of change, or slope of the graph, and the 50 represents the initial amount, or vertical intercept of the graph. We'll learn about some more ways to think about this equation in future lessons.
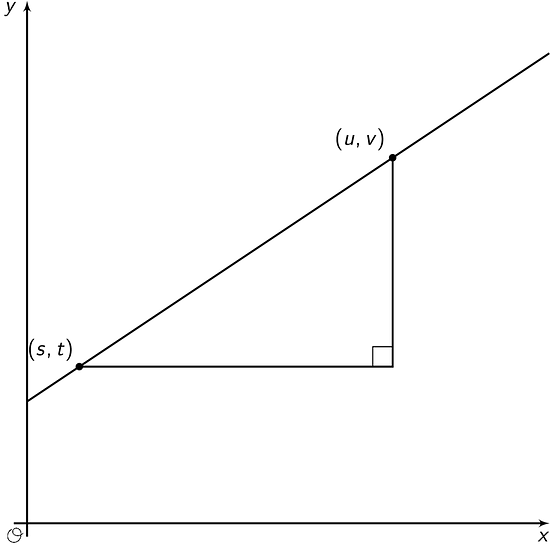
Now what if we didn't have a description to use to figure out the slope and the vertical intercept? That's okay so long as we can find some points on the line! For the line graphed here, two of the points on the line are and and we can use these points to draw in a slope triangle as shown:

The slope of this line is the quotient of the length of the vertical side of the slope triangle and the length of the horizontal side of the slope triangle. So the slope, , is . We can also see from the graph that the vertical intercept, , is 2. Putting these together, we can say that the equation for this line is .
Lesson 3 Practice Problems
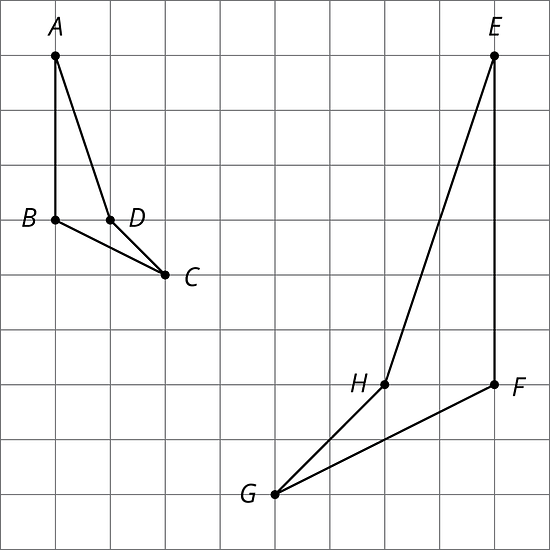
Show that the two figures are similar by identifying a sequence of translations, rotations, reflections, and dilations that takes the larger figure to the smaller one.
Create a graph that shows three linear relationships with different -intercepts using the following slopes, and write an equation for each line.
Slopes:
The graph shows the height in inches, , of a bamboo plant months after it has been planted.
- Write an equation that describes the relationship between and .
- After how many months will the bamboo plant be 66 inches tall? Explain or show your reasoning.

Describe how you can tell whether a line’s slope is greater than 1, equal to 1, or less than 1.
A line is represented by the equation . What are the coordinates of some points that lie on the line? Graph the line on graph paper.