Lesson 10Piecewise Linear Functions
Let’s explore functions built out of linear pieces.
Learning Targets:
- I can create graphs of non-linear functions with pieces of linear functions.
10.1 Notice and Wonder: Lines on Dots
What do you notice? What do you wonder?

10.2 Modeling Recycling

- Approximate the percentage recycled each year with a piecewise linear function by drawing between three and five line segments to approximate the graph.
- Find the slope for each piece. What do these slopes tell you?
10.3 Dog Bath
Elena filled up the tub and gave her dog a bath. Then she let the water out of the tub.
- The graph shows the amount of water in the tub, in gallons, as a function of time, in minutes. Add labels to the graph to show this.
- When did she turn off the water faucet?
- How much water was in the tub when she bathed her dog?
- How long did it take for the tub to drain completely?
- At what rate did the faucet fill the tub?
- At what rate did the water drain from the tub?
10.4 Distance and Speed

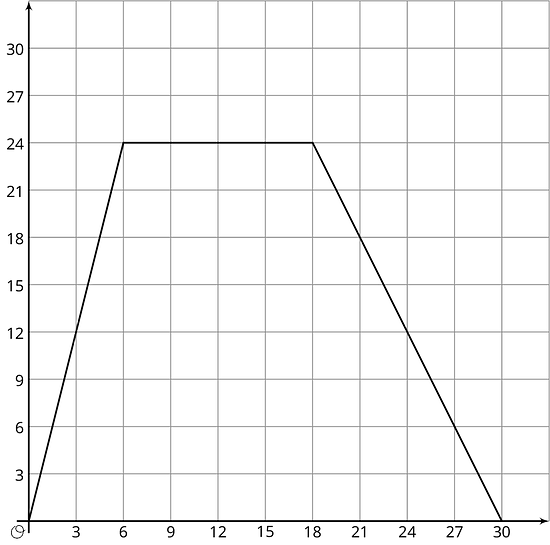
The graph shows the speed of a car as a function of time. Describe what a person watching the car would see.
Are you ready for more?
The graph models the speed of a car over a function of time during a
3-hour trip. How far did the car go over the course of the trip?
There is a nice way to visualize this quantity in terms of the graph. Can you find it?

Lesson 10 Summary
This graph shows Andre biking to his friend’s house where he hangs out for a while. Then they bike together to the store to buy some groceries before racing back to Andre’s house for a movie night. Each line segment in the graph represents a different part of Andre’s travels.

This is an example of a piecewise linear function, which is a function whose graph is pieced together out of line segments. It can be used to model situations in which a quantity changes at a constant rate for a while, then switches to a different constant rate.
We can use piecewise functions to represent stories, or we can use them to model actual data. In the second example, temperature recordings at several times throughout a day are modeled with a piecewise function made up of two line segments. Which line segment do you think does the best job of modeling the data?
Lesson 10 Practice Problems
The graph shows the distance of a car from home as a function of time.

Describe what a person watching the car may be seeing.
The equation and the graph represent two functions. Use the equation and the graph to answer the questions.
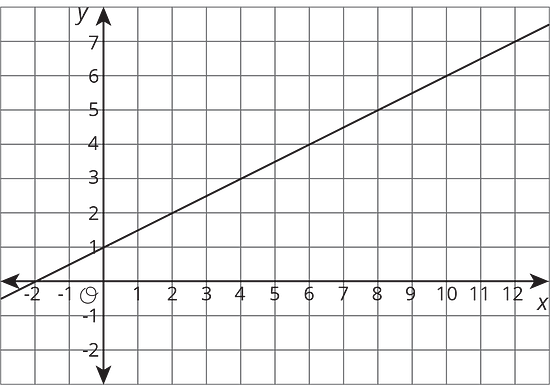
- When is 4, is the output of the equation or the graph greater?
- What value for produces the same output in both the graph and the equation?

This graph shows a trip on a bike trail. The trail has markers every 0.5 km showing the distance from the beginning of the trail.
-
When was the bike rider going the fastest?
-
When was the bike rider going the slowest?
-
During what times was the rider going away from the beginning of the trail?
-
During what times was the rider going back towards the beginning of the trail?
-
During what times did the rider stop?
-
The expression represents the volume of liquid of a container after seconds. The expression represents the volume of liquid of another container after seconds. What does the equation mean in this situation?