Lesson 11Filling containers
Let’s fill containers with water.
Learning Targets:
- I can collect data about a function and represent it as a graph.
- I can describe the graph of a function in words.
11.1 Which One Doesn’t Belong: Solids
These are drawings of three-dimensional objects. Which one doesn’t belong? Explain your reasoning.

11.2 Height and Volume
Use the applet to investigate the height of water in the cylinder as a function of the water volume.
-
Before you get started, make a prediction about the shape of the graph.
-
Check Reset and set the radius and height of the graduated cylinder to values you choose.
- Let the cylinder fill with different amounts of water and record the data in the table.
- Create a graph that shows the height of the water in the cylinder as a function of the water volume.
- Choose a point on the graph and explain its meaning in the context of the situation.
11.3 What Is the Shape?
- The graph shows the height vs. volume function of an unknown container. What shape could this container have? Explain how you know and draw a possible container.

- The graph shows the height vs. volume function of a different unknown container. What shape could this container have? Explain how you know and draw a possible container.

- How are the two containers similar? How are they different?
Are you ready for more?
The graph shows the height vs. volume function of an unknown container. What shape could this container have? Explain how you know and draw a possible container.

Lesson 11 Summary
When filling a shape like a cylinder with water, we can see how the dimensions of the cylinder affect things like the changing height of the water. For example, let's say we have two cylinders, and , with the same height, but has a radius of 3 cm and has a radius of 6 cm.

If we pour water into both cylinders at the same rate, the height of water in will increase faster than the height of water in due to its smaller radius. This means that if we made graphs of the height of water as a function of the volume of water for each cylinder, we would have two lines and the slope of the line for cylinder would be greater than the slope of the line for cylinder .
Lesson 11 Practice Problems
Cylinder A, B, and C have the same radius but different heights. Put the cylinders in order of their volume from least to greatest.

Two cylinders, and , each started with different amounts of water. The graph shows how the height of the water changed as the volume of water increased in each cylinder. Match the graphs of and to Cylinders P and Q. Explain your reasoning.


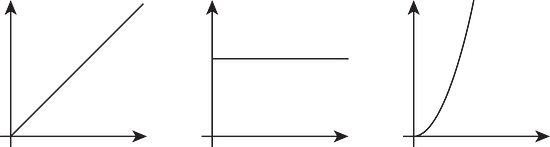
Which of the following graphs could represent the volume of water in a cylinder as a function of its height? Explain your reasoning.
Together, the areas of the rectangles sum to 30 square centimeters.

- Write an equation showing the relationship between and .
- Fill in the table with the missing values.
3 8 12 5 10