Lesson 6Even More Graphs of Functions
Let’s draw a graph from a story.
Learning Targets:
- I can draw the graph of a function that represents a real-world situation.
6.1 Dog Run
Here are five pictures of a dog taken at equal intervals of time.
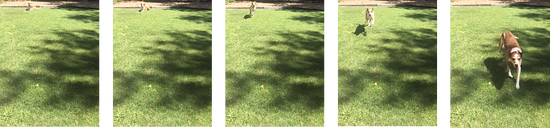
Diego and Lin drew different graphs to represent this situation:

6.2 Which Graph is It?
For each situation,
- name the independent and dependent variables
- pick the graph that best fits the situation, or sketch the graph if one isn't provided
- label the axes
- answer the question: which quantity is a function of which? Be prepared to explain your reasoning.
- Jada is training for a swimming race. The more she practices, the less time it takes for her to swim one lap.

- Andre adds some money to a jar in his room each week for 3 weeks and then takes some out in week 4.
6.3 Sketching a Story about a Boy and a Bike
You will use the tools in the applet for creating a visual display that shows your response to each question.
Here is a story: “Noah was at home. He got on his bike and rode to his friend’s house and stayed there for awhile. Then he rode home again. Then he rode to the park. Then he rode home again.”
-
Sketch a graph of this story.
-
What are the two quantities? Label the axes with their names and units of measure. (For example, if this were a story about pouring water into a pitcher, one of your labels might say “volume (liters).”)
- Which quantity is a function of which? Explain your reasoning.
- Based on your graph, is his friend’s house or the park closer to Noah's home? Explain how you know.
- Read the story and all your responses again. Does everything make sense? If not, make changes to your work.
Note: To change the values on the axes, select the Move Graphics tool

click near the end of the axis you want to change, and drag it to grow or shrink it.
Are you ready for more?
Lesson 6 Summary
Here is a graph showing Andre's distance as a function of time.

For a graph representing a context, it is important to specify the quantities represented on each axis. For example, if this is showing distance from home, then Andre starts at some distance from home (maybe at his friend’s house), moves further away (maybe to a park), then returns home. If instead the graph is showing distance from school, the story may be Andre starts out at home, moves further away (maybe to a friend's house), then goes to school. What could the story be if the graph is showing distance from a park?
Lesson 6 Practice Problems
Match the graph to the following situations (you can use a graph multiple times). For each match, name possible independent and dependent variables and how you would label the axes.
- Tyler pours the same amount of milk from a bottle every morning.
- A plant grows the same amount every week.
- The day started very warm but then it got colder.
- A carnival has an entry fee of $5 and tickets for rides cost $1 each.

Jada fills her aquarium with water.
The graph shows the height of the water, in cm, in the aquarium as a function of time in minutes. Invent a story of how Jada fills the aquarium that fits the graph.

Recall the formula for area of a circle.
- Write an equation relating a circle’s radius, , and area, .
- Is area a function of the radius? Is radius a function of the area?
- Fill in the missing parts of the table.
3
The points with coordinates , , and all lie on the line .
- Create a graph, plot the points, and sketch the line.
- What is the slope of the line you graphed?
- What does this slope tell you about the relationship between lengths and widths of rectangles with perimeter 24?
