Lesson 7Connecting Representations of Functions
Let’s connect tables, equations, graphs, and stories of functions.
Learning Targets:
- I can compare inputs and outputs of functions that are represented in different ways.
7.1 Which are the Same? Which are Different?
Here are three different ways of representing functions. How are they alike? How are they different?
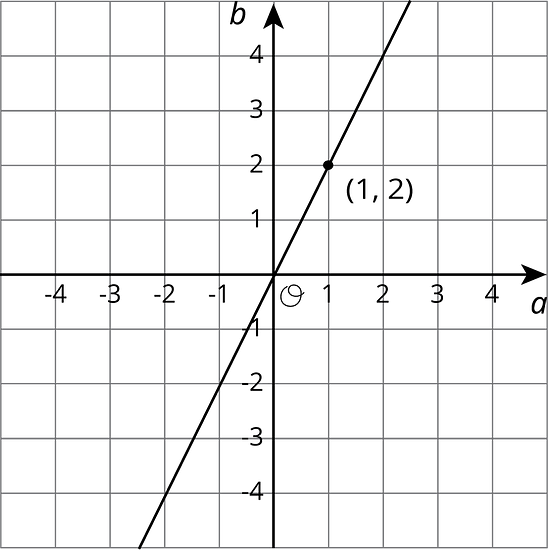
-
-2 -1 0 1 2 3 4 2 0 -2 -4 -6
7.2 Comparing Temperatures
The graph shows the temperature between noon and midnight in City A on a certain day.

The table shows the temperature, , in degrees Fahrenheit, for hours after noon, in City B.
| 1 | 2 | 3 | 4 | 5 | 6 | |
| 82 | 78 | 75 | 62 | 58 | 59 |
- Which city was warmer at 4:00 p.m.?
- Which city had a bigger change in temperature between 1:00 p.m. and 5:00 p.m.?
- How much greater was the highest recorded temperature in City B than the highest recorded temperature in City A during this time?
- Compare the outputs of the functions when the input is 3.
7.3 Comparing Volumes
The volume, , of a cube with side length is given by the equation . The graph of the volume of a sphere as a function of its radius is shown.
-
Is the volume of a cube with side length greater or less than a sphere with radius 3?
-
Estimate the radius of a sphere that has the same volume as a cube with side length 5.
-
Compare the outputs of the two volume functions when the inputs are 2.
Here is an applet to use if you choose. Note: If you want to graph an equation with this applet, it expects you to enter as a function of , so you need to use instead of and instead of .
Are you ready for more?
7.4 It’s Not a Race
Elena’s family is driving on the freeway at 55 miles per hour.
Andre’s family is driving on the same freeway, but not at a constant speed. The table shows how far Andre's family has traveled, , in miles, every minute for 10 minutes.
| 1 | 2 | 3 | 4 | 5 | 6 | 7 | 8 | 9 | 10 | |
| 0.9 | 1.9 | 3.0 | 4.1 | 5.1 | 6.2 | 6.8 | 7.4 | 8 | 9.1 |
- How many miles per minute is 55 miles per hour?
- Who had traveled farther after 5 minutes? After 10 minutes?
- How long did it take Elena’s family to travel as far as Andre’s family had traveled after 8 minutes?
- For both families, the distance in miles is a function of time in minutes. Compare the outputs of these functions when the input is 3.
Lesson 7 Summary
Functions are all about getting outputs from inputs. For each way of representing a function—equation, graph, table, or verbal description—we can determine the output for a given input.
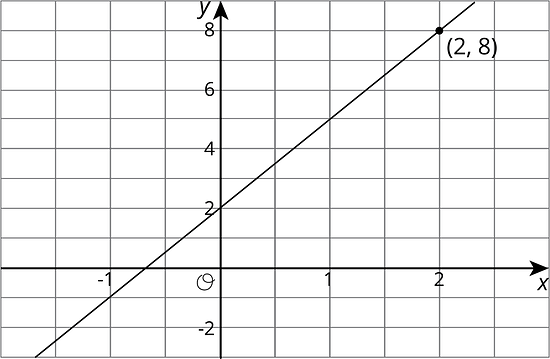
Let's say we have a function represented by the equation where is the dependent variable and is the independent variable. If we wanted to find the output that goes with 2, we can input 2 into the equation for and finding the corresponding value of . In this case, when is 2, is 8 since .
If we had a graph of this function instead, then the coordinates of points on the graph are the input-output pairs. So we would read the -coordinate of the point on the graph that corresponds to a value of 2 for . Looking at the graph of this function here, we can see the point on it, so the output is 8 when the input is 2.
A table representing this function shows the input-output pairs directly (although only for select inputs).
| -1 | 0 | 1 | 2 | 3 | |
| -1 | 2 | 5 | 8 | 11 |
Again, the table shows that if the input is 2, the output is 8.
Lesson 7 Practice Problems
The equation and the tables represent two different functions. Use the equation and the table to answer the questions. This table represents as a function of .
-3 0 2 5 10 12 -20 7 3 21 19 45 - When is -3, is or greater?
- When is 21, what is the value of ? What is the value of that goes with this value of ?
- When is 6, is or greater?
- For what values of do we know that is greater than ?
Match each function rule with the value that could not be a possible input for that function.
- 3 divided by the input
- Add 4 to the input, then divide this value into 3
- Subtract 3 from the input, then divide this value into 1
- 3
- 4
- -4
- 0
- 1
Elena and Lin are training for a race. Elena runs her mile a constant speed of 7.5 miles per hour.
Lin’s times are recorded every minute:
time (minutes) 1 2 3 4 5 6 7 8 9 distance (miles) 0.11 0.21 0.32 0.41 0.53 0.62 0.73 0.85 1 -
Who finished their mile first?
-
This is a graph of Lin’s progress. Draw a graph to represent Elena’s mile on the same axes.

-
For these models, is distance a function of time? Is time a function of distance? Explain how you know.
-
Find a value of that makes the equation true: Explain your reasoning, and check that your answer is correct.