Lesson 8Writing and Graphing Inequalities
Let’s write inequalities.
Learning Targets:
- I can graph inequalities on a number line.
- I can write an inequality to represent a situation.
8.1 Estimate Heights of People
-
Here is a picture of a man.
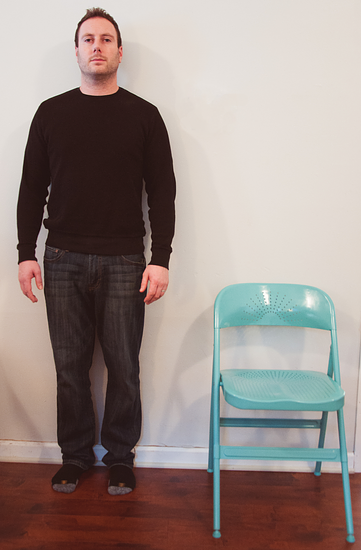
- Name a number, in feet, that is clearly too high for this man’s height.
- Name a number, in feet, that is clearly too low for his height.
- Make an estimate of his height.
Pause here for a class discussion.
-
Here is a picture of the same man standing next to a child.
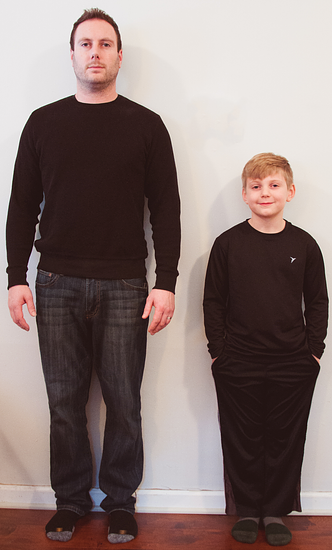
If the man’s actual height is 5 feet 10 inches, what can you say about the height of the child in this picture?
Be prepared to explain your reasoning.
8.2 Stories about 9
Drag the green and red open points over the blue points, matching each story, graph, and description.
- Record your results with a number followed by a capital letter and a lowercase letter. For example, 1Aa would mean that responses “1”, “A”, and “a” all represent the same situation.
- Think about how you would represent each set of numbers with an inequality statement, talk about it with your partner, and be prepared to discuss your ideas with the class.
-
Record your final matching decisions like this:
- A fishing boat can hold fewer than 9 people. How many people () can it hold?
-
Description or list:
- Number line:

-
Inequality:
-
- Lin needs more than 9 ounces of butter to make cookies for her party. How many ounces of butter () would be enough?
-
Description or list:
- Number line:
-
Inequality:
-
- A magician will perform her magic tricks only if there are at least 9 people in the audience. For how many people () will she perform her magic tricks?
-
Description or list:
- Number line:
-
Inequality:
-
- A food scale can measure up to 9 kilograms of weight. What weights () can the scale measure?
-
Description or list:
- Number line:
-
Inequality:
-
- A fishing boat can hold fewer than 9 people. How many people () can it hold?
8.3 How High and How Low Can It Be?
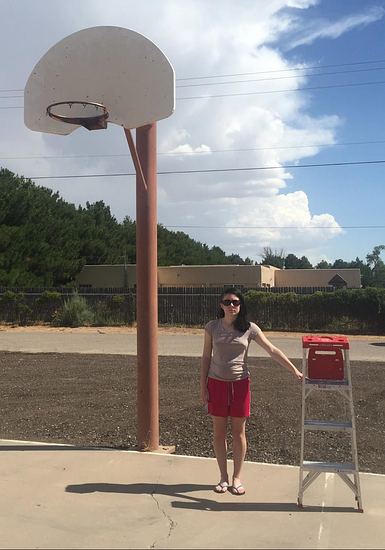
Here is a picture of a person and a basketball hoop. Based on the picture, what do you think are reasonable estimates for the maximum and minimum heights of the basketball hoop?
-
Complete the first blank in each sentence with an estimate, and the second blank with “taller” or “shorter.”
-
I estimate the minimum height of the basketball hoop to be _________ feet; this means the hoop cannot be _____________ than this height.
-
I estimate the maximum height of the basketball hoop to be _________ feet; this means the hoop cannot be _____________ than this height.
-
-
Write two inequalities—one to show your estimate for the minimum height of the basketball hoop, and another for the maximum height. Use an inequality symbol and the variable to represent the unknown height.
-
Plot each estimate for minimum or maximum value on a number line.
Minimum:

Maximum:
- Suppose a classmate estimated the value of to be 19 feet. Does this estimate agree with your inequality for the maximum height? Does it agree with your inequality for the minimum height? Explain or show how you know.
- Ask a partner for an estimate of . Record the estimate and check if it agrees with your inequalities for maximum and minimum heights.
Are you ready for more?
- Find 3 different numbers that could be if . Plot these points on the number line. Then plot as many other possibilities for as you can.

- Find 3 different numbers that could be if . Plot these points on the number line. Then plot as many other possibilities for as you can.
Lesson 8 Summary
An inequality tells us that one value is less than or greater than another value.
Suppose we knew the temperature is less than , but we don’t know exactly what it is. To represent what we know about the temperature in we can write the inequality:
The temperature can also be graphed on a number line. Any point to the left of 3 is a possible value for . The open circle at 3 means that cannot be equal to 3, because the temperature is less than 3.

Here is another example. Suppose a young traveler has to be at least 16 years old to fly on an airplane without an accompanying adult.
If represents the age of the traveler, any number greater than 16 is a possible value for , and 16 itself is also a possible value of . We can show this on a number line by drawing a closed circle at 16 to show that it meets the requirement (a 16-year-old person can travel alone). From there, we draw a line that points to the right.

We can also write an inequality and equation to show possible values for :
Lesson 8 Practice Problems
At the book sale, all books cost less than $5.
- What is the most expensive a book could be?
- Write an inequality to represent costs of books at the sale.
- Draw a number line to represent the inequality.
Kiran started his homework before 7:00 p.m. and finished his homework after 8:00 p.m. Let represent the number of hours Kiran worked on his homework.
Decide if each statement it is definitely true, definitely not true, or possibly true. Explain your reasoning.
-
Consider a rectangular prism with length 4 and width and height .
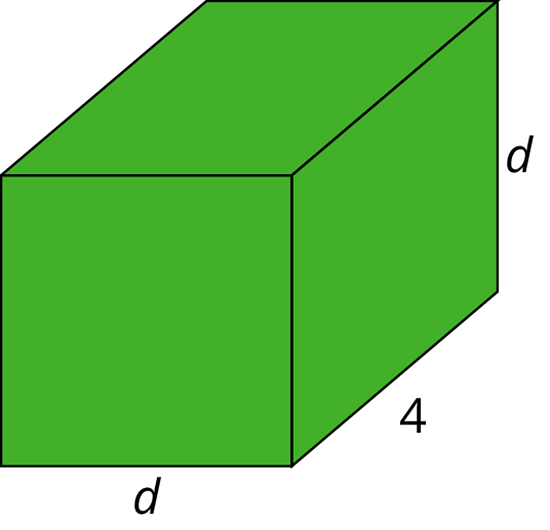
- Find an expression for the volume of the prism in terms of .
- Compute the volume of the prism when , when , and when .
Match the mathematical statements with the statements written in English. All of these statements are true.
- The number -15 is further away from 0 than the number -12 on the number line.
- The number -12 is a distance of 12 units away from 0 on the number line.
- The distance between -12 and 0 on the number line is greater than -15.
- The numbers 12 and -12 are the same distance away from 0 on the number line.
- The number -15 is less than the number -12.
- The number 12 is greater than the number -12.
Here are five sums. Use the distributive property to write each sum as a product with two factors.