Grade 7 Glossary
- absolute value
- Unit 5 Lesson 1
The absolute value of a number is its distance from 0 on the number line.

The absolute value of -7 is 7, because it is 7 units away from 0. The absolute value of 5 is 5, because it is 5 units away from 0.
- adjacent angles
- Unit 7 Lesson 1, Unit 7 Lesson 2, Unit 7 Lesson 3, Unit 7 Lesson 4, Unit 7 Lesson 5
Adjacent angles share a side and a vertex.
In this diagram, angle
is adjacent to angle . 
- area
- Unit 1 Lesson 6
Area is the number of square units that covers a two-dimensional region, without any gaps or overlaps.
For example, the area of region A is 8 square units. The area of the shaded region of B is
square unit. 
- area of a circle
- Unit 3 Lesson 7, Unit 3 Lesson 8, Unit 3 Lesson 9
If the radius of a circle is
units, then the area of the circle is square units. For example, a circle has radius 3 inches. Its area is
square inches, or square inches, which is approximately 28.3 square inches. - base (of a prism or pyramid)
- Unit 7 Lesson 11, Unit 7 Lesson 12, Unit 7 Lesson 13, Unit 7 Lesson 14, Unit 7 Lesson 15, Unit 7 Lesson 16
The word base can also refer to a face of a polyhedron.
A prism has two identical bases that are parallel. A pyramid has one base.
A prism or pyramid is named for the shape of its base.

- chance experiment
- Unit 8 Lesson 2, Unit 8 Lesson 3, Unit 8 Lesson 4, Unit 8 Lesson 5, Unit 8 Lesson 6
A chance experiment is something you can do over and over again, and you don’t know what will happen each time.
For example, each time you spin the spinner, it could land on red, yellow, blue, or green.

A circle is made out of all the points that are the same distance from a given point.
For example, every point on this circle is 5 cm away from point
, which is the center of the circle. 
- circumference
- Unit 3 Lesson 2, Unit 3 Lesson 3, Unit 3 Lesson 4, Unit 3 Lesson 5
The circumference of a circle is the distance around the circle. If you imagine the circle as a piece of string, it is the length of the string. If the circle has radius
then the circumference is . The circumference of a circle of radius 3 is
, which is about 18.85. - complementary
- Unit 7 Lesson 2, Unit 7 Lesson 3, Unit 7 Lesson 4, Unit 7 Lesson 5
Complementary angles have measures that add up to 90 degrees.
For example, a
angle and a angle are complementary. 

- constant of proportionality
- Unit 2 Lesson 2, Unit 2 Lesson 3, Unit 2 Lesson 4, Unit 2 Lesson 5, Unit 2 Lesson 6
In a proportional relationship, the values for one quantity are each multiplied by the same number to get the values for the other quantity. This number is called the constant of proportionality.
In this example, the constant of proportionality is
, because , , and . This means that there are 3 apples for every 1 orange in the fruit salad. number of oranges
number of apples
- coordinate plane
- Unit 2 Lesson 10, Unit 2 Lesson 11, Unit 2 Lesson 12, Unit 2 Lesson 13, Unit 3 Lesson 11
The coordinate plane is a system for telling where points are. For example, point
is located at on the coordinate plane, because it is three units to the right and two units up. 
- corresponding
- Unit 1 Lesson 2, Unit 1 Lesson 3, Unit 1 Lesson 4, Unit 1 Lesson 5, Unit 1 Lesson 6
When part of an original figure matches up with part of a copy, we call them corresponding parts. These could be points, segments, angles, or distances.
For example, point
in the first triangle corresponds to point in the second triangle. Segment
corresponds to segment . 
- cross section
- Unit 7 Lesson 11, Unit 7 Lesson 13, Unit 7 Lesson 14, Unit 7 Lesson 15, Unit 7 Lesson 16
A cross section is the new face you see when you slice through a three-dimensional figure.
For example, if you slice a rectangular pyramid parallel to the base, you get a smaller rectangle as the cross section.

When you put money into an account, it is called a deposit.
For example, a person added $60 to their bank account. Before the deposit, they had $435. After the deposit, they had $495, because
. A diameter is a line segment that goes from one edge of a circle to the other and passes through the center. A diameter can go in any direction. Every diameter of the circle is the same length. We also use the word diameter to mean the length of this segment.

- equivalent expressions
- Unit 6 Lesson 3, Unit 6 Lesson 4, Unit 6 Lesson 5, Unit 6 Lesson 6
Equivalent expressions are always equal to each other. If the expressions have variables, they are equal whenever the same value is used for the variable in each expression.
For example,
is equivalent to . No matter what value we use for , these expressions are always equal. When , both expressions equal 21. When , both expressions equal 70. - equivalent ratios
- Unit 2 Lesson 1, Unit 2 Lesson 2, Unit 2 Lesson 3
Two ratios are equivalent if you can multiply each of the numbers in the first ratio by the same factor to get the numbers in the second ratio. For example,
is equivalent to , because and . A recipe for lemonade says to use 8 cups of water and 6 lemons. If we use 4 cups of water and 3 lemons, it will make half as much lemonade. Both recipes taste the same, because
and are equivalent ratios. cups of water
number of lemons
An event is a set of one or more outcomes in a chance experiment. For example, if we roll a number cube, there are six possible outcomes.

Examples of events are “rolling a number less than 3,” “rolling an even number,” or “rolling a 5.”
- expand
- Unit 6 Lesson 21, Unit 6 Lesson 22
To expand an expression, we use the distributive property to rewrite a product as a sum. The new expression is equivalent to the original expression.
For example, we can expand the expression
to get the equivalent expression . - factor
- Unit 6 Lesson 22
A factor of a whole number is a whole number that divides it evenly without a remainder.
For example, 1, 2, 3, 4, 6, and 12 are all factors of 12, but 5 is not a factor.
- factor (an expression)
- Unit 6 Lesson 19, Unit 6 Lesson 21, Unit 6 Lesson 22
To factor an expression, we use the distributive property to rewrite a sum as a product. The new expression is equivalent to the original expression.
For example, we can factor the expression
to get the equivalent expression . - interquartile range (IQR)
- Unit 8 Lesson 8, Unit 8 Lesson 13, Unit 8 Lesson 14, Unit 8 Lesson 15, Unit 8 Lesson 17
The interquartile range is one way to measure how spread out a data set is. We sometimes call this the IQR. To find the interquartile range we subtract the first quartile from the third quartile.
22
29
30
31
32
43
44
45
50
50
59
Q1
Q2
Q3
For example, the IQR of this data set is 20 because
. - long division
- Unit 4 Lesson 5
Long division is a way to show the steps for dividing numbers in decimal form. It finds the quotient one digit at a time, from left to right.
For example, here is the long division for
. The mean is one way to measure the center of a data set. We can think of it as a balance point. For example, for the data set 7, 9, 12, 13, 14, the mean is 11.

To find the mean, add up all the numbers in the data set. Then, divide by how many numbers there are.
and . - mean absolute deviation (MAD)
- Unit 8 Lesson 10, Unit 8 Lesson 11, Unit 8 Lesson 12
The mean absolute deviation is one way to measure how spread out a data set is. Sometimes we call this the MAD. For example, for the data set 7, 9, 12, 13, 14, the MAD is 2.4. This tells us that these travel times are typically 2.4 minutes away from the mean, which is 11.
To find the MAD, add up the distance between each data point and the mean. Then, divide by how many numbers there are.
and . - measurement error
- Unit 4 Lesson 13, Unit 4 Lesson 14, Unit 4 Lesson 15
Measurement error is the positive difference between a measured amount and the actual amount.
For example, Diego measures a line segment and gets 5.3 cm. The actual length of the segment is really 5.32 cm. The measurement error is 0.02 cm, because
. The median is one way to measure the center of a data set. It is the middle number when the data set is listed in order.
For the data set 7, 9, 12, 13, 14, the median is 12.
For the data set 3, 5, 6, 8, 11, 12, there are two numbers in the middle. The median is the average of these two numbers.
and . - mode
- Unit 8 Lesson 9
The measure of central tendency for a one-variable data set that is the value(s) that occurs most often.
- negative number
- Unit 5 Lesson 1
A negative number is a number that is less than zero. On a horizontal number line, negative numbers are usually shown to the left of 0.

The origin is the point
in the coordinate plane. This is where the horizontal axis and the vertical axis cross. 
An outcome of a chance experiment is one of the things that can happen when you do the experiment. For example, the possible outcomes of tossing a coin are heads and tails.
- percent error
- Unit 4 Lesson 14, Unit 4 Lesson 15
Percent error is a way to describe error, expressed as a percentage of the actual amount.
For example, a box is supposed to have 150 folders in it. Clare counts only 147 folders in the box. This is an error of 3 folders. The percent error is 2%, because 3 is 2% of 150.
. - percentage
- Unit 4 Lesson 1, Unit 4 Lesson 3, Unit 4 Lesson 4, Unit 4 Lesson 5
A percentage is a rate per 100.
For example, a fish tank can hold 36 liters. Right now there is 27 liters of water in the tank. The percentage of the tank that is full is 75%.

- percentage decrease
- Unit 4 Lesson 6, Unit 4 Lesson 7, Unit 4 Lesson 8, Unit 4 Lesson 9
A percentage decrease tells how much a quantity went down, expressed as a percentage of the starting amount.
For example, a store had
hats in stock on Friday. The had hats left on Saturday. The amount went down by . This was a
decrease, because is of . 
- percentage increase
- Unit 4 Lesson 6, Unit 4 Lesson 7, Unit 4 Lesson 8, Unit 4 Lesson 9
A percentage increase tell how much a quantity went up, expressed as a percentage of the starting amount.
For example, Elena had
in the bank on Monday. She had on Tuesday. The amount went up by . This was a
increase, because is of . 
There is a proportional relationship between the diameter and circumference of any circle. The constant of proportionality is pi. The symbol for pi is
. We can represent this relationship with the equation
, where represents the circumference and represents the diameter. Some approximations for
are , 3.14, and 3.14159. 
- population
- Unit 8 Lesson 10, Unit 8 Lesson 11, Unit 8 Lesson 12
A population is a set of people or things that we want to study.
For example, if we want to study the heights of people on different sports teams, the population would be all the people on the teams.
- positive number
- Unit 5 Lesson 1
A positive number is a number that is greater than zero. On a horizontal number line, positive numbers are usually shown to the right of 0.

- prism
- Unit 7 Lesson 11, Unit 7 Lesson 12, Unit 7 Lesson 13, Unit 7 Lesson 14, Unit 7 Lesson 15, Unit 7 Lesson 16
A prism is a type of polyhedron that has two bases that are identical copies of each other. The bases are connected by rectangles or parallelograms.
Here are some drawings of prisms.

- probability
- Unit 8 Lesson 3, Unit 8 Lesson 4, Unit 8 Lesson 5, Unit 8 Lesson 6
The probability of an event is a number that tells how likely it is to happen. A probability of 1 means the event will always happen. A probability of 0 means the event will never happen.
For example, the probability of selecting a moon block at random from this bag is
. 
- proportion
- Unit 8 Lesson 14, Unit 8 Lesson 15, Unit 8 Lesson 17
A proportion of a data set is the fraction of the data in a given category.
For example, a class has 18 students. There are 2 left-handed students and 16 right-handed students in the class. The proportion of students who are left-handed is
, or 0.1. - proportional relationship
- Unit 2 Lesson 2, Unit 2 Lesson 3, Unit 2 Lesson 5
In a proportional relationship, the values for one quantity are each multiplied by the same number to get the values for the other quantity.
For example, in this table every value of
is equal to 4 times the value of on the same row. We can write this relationship as
. This equation shows that is proportional to . 2
8
3
12
5
20
10
40
A pyramid is a type of polyhedron that has one base. All the other faces are triangles, and they all meet at a single vertex.
Here are some drawings of pyramids.

- quartile
- Unit 8 Lesson 8
Quartiles are the numbers that divide a data set into four sections that each have the same number of values.
For example, in this data set the first quartile is 30. The second quartile is the same thing as the median, which is 43. The third quartile is 50.
Q1
Q2
Q3
A radius is a line segment that goes from the center to the edge of a circle. A radius can go in any direction. Every radius of the circle is the same length. We also use the word radius to mean the length of this segment.
For example,
is the radius of this circle with center . 
Outcomes of a chance experiment are random if they are all equally likely to happen.
- ratio
- Unit 2 Lesson 3
A ratio is an association between two or more quantities.
For example, the ratio
could describe a recipe that uses 3 cups of flour for every 2 eggs, or a boat that moves 3 meters every 2 seconds. One way to represent the ratio is with a diagram that has 3 blue squares for every 2 green squares. 
- rational number
- Unit 4 Lesson 5, Unit 5 Lesson 13
A rational number is a fraction or the opposite of a fraction.
For example, 8 and -8 are rational numbers because they can be written as
and . Also, 0.75 and -0.75 are rational numbers because they can be written as
and . - reciprocal
- Unit 1 Lesson 5, Unit 1 Lesson 6
Dividing 1 by a number gives the reciprocal of that number.
For example, the reciprocal of 12 is
, and the reciprocal of is . - repeating decimal
- Unit 4 Lesson 5
A repeating decimal has digits that keep going in the same pattern over and over. The repeating digits are marked with a line above them.
For example, the decimal representation for
is , which means 0.3333333 … The decimal representation for is which means 1.136363636 … - representative
- Unit 8 Lesson 11, Unit 8 Lesson 12
A sample is representative of a population if its distribution resembles the population’s distribution in center, shape, and spread.
For example, this dot plot represents a population.

This dot plot shows a sample that is representative of the population.

- right angle
- Unit 7 Lesson 1, Unit 7 Lesson 2, Unit 7 Lesson 3, Unit 7 Lesson 4, Unit 7 Lesson 5
A right angle is half of a straight angle. It measures 90 degrees.

A sample is part of a population. For example, a population could be all the seventh grade students at one school. One sample of that population is all the seventh grade students who are in band.
- sample space
- Unit 8 Lesson 3, Unit 8 Lesson 4, Unit 8 Lesson 5, Unit 8 Lesson 6
The sample space is the list of every possible outcome for a chance experiment.
For example, the sample space for tossing two coins is:
heads-heads
tails-heads
heads-tails
tails-tails


- scale
- Unit 1 Lesson 7, Unit 1 Lesson 8, Unit 1 Lesson 9, Unit 1 Lesson 10, Unit 1 Lesson 11, Unit 1 Lesson 12
A scale tells how the measurements in a scale drawing represent the actual measurements of the object.
For example, the scale on this floor plan tells us that 1 inch on the drawing represents 8 feet in the actual room. This means that 2 inches would represent 16 feet, and
inch would represent 4 feet. 
- scale drawing
- Unit 1 Lesson 7, Unit 1 Lesson 8, Unit 1 Lesson 9, Unit 1 Lesson 10, Unit 1 Lesson 11, Unit 1 Lesson 12
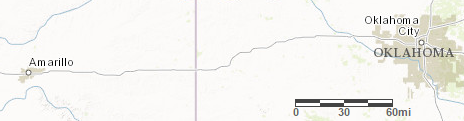
A scale drawing represents an actual place or object. All the measurements in the drawing correspond to the measurements of the actual object by the same scale.
For example, this map is a scale drawing.
- scale factor
- Unit 1 Lesson 2, Unit 1 Lesson 3, Unit 1 Lesson 4, Unit 1 Lesson 5, Unit 1 Lesson 6
To create a scaled copy, we multiply all the lengths in the original figure by the same number. This number is called the scale factor.
In this example, the scale factor is 1.5, because
, , and . 
- scaled copy
- Unit 1 Lesson 1, Unit 1 Lesson 2, Unit 1 Lesson 3, Unit 1 Lesson 4, Unit 1 Lesson 5, Unit 1 Lesson 6
A scaled copy is a copy of a figure where every length in the original figure is multiplied by the same number.
For example, triangle
is a scaled copy of triangle . Each side length on triangle was multiplied by 1.5 to get the corresponding side length on triangle . - simulation
- Unit 8 Lesson 6
A simulation is an experiment that is used to estimate the probability of a real-world event.
For example, suppose the weather forecast says there is a 25% chance of rain. We can simulate this situation with a spinner with four equal sections. If the spinner stops on red, it represents rain. If the spinner stops on any other color, it represents no rain.

- solution to an equation
- Unit 5 Lesson 11, Unit 5 Lesson 12
A solution to an equation is a number that can be used in place of the variable to make the equation true.
For example, 7 is the solution to the equation
, because it is true that . The solution to is not 9, because . - solution to an inequality
- Unit 6 Lesson 14, Unit 6 Lesson 15, Unit 6 Lesson 16, Unit 6 Lesson 17
A solution to an inequality is a number that can be used in place of the variable to make the inequality true
For example, 5 is a solution to the inequality
, because it is true that . Some other solutions to this inequality are 9.9, 0, and -4. - squared
- Unit 3 Lesson 8, Unit 3 Lesson 9
We use the word squared to mean “to the second power.” This is because a square with side length
has an area of , or . - straight angle
- Unit 7 Lesson 1, Unit 7 Lesson 2, Unit 7 Lesson 3, Unit 7 Lesson 4, Unit 7 Lesson 5
A straight angle is an angle that forms a straight line. It measures 180 degrees.

- supplementary
- Unit 7 Lesson 2, Unit 7 Lesson 3, Unit 7 Lesson 4, Unit 7 Lesson 5
Supplementary angles have measures that add up to 180 degrees.
For example, a
angle and a angle are supplementary. 

- surface area
- Unit 7 Lesson 14, Unit 7 Lesson 15, Unit 7 Lesson 16
The surface area of a polyhedron is the number of square units that covers all the faces of the polyhedron, without any gaps or overlaps.
For example, if the faces of a cube each have an area of 9 cm², then the surface area of the cube is
, or 54 cm². - tape diagram
- Unit 4 Lesson 4, Unit 4 Lesson 5
A tape diagram is a group of rectangles put together to represent a relationship between quantities.
For example, this tape diagram shows a ratio of 30 gallons of yellow paint to 50 gallons of blue paint.

If each rectangle were labeled 5, instead of 10, then the same picture could represent the equivalent ratio of 15 gallons of yellow paint to 25 gallons of blue paint.
A term is a part of an expression. It can be a single number, a variable, or a number and a variable that are multiplied together.
For example, the expression
has two terms. The first term is and the second term is 18. - unit rate
- Unit 4 Lesson 2, Unit 4 Lesson 3, Unit 4 Lesson 4, Unit 4 Lesson 5
A unit rate is a rate per 1.
For example, 12 people share 2 pies equally. One unit rate is 6 people per pie, because
. The other unit rate is of a pie per person, because . - variable
- Unit 5 Lesson 15, Unit 5 Lesson 16
A variable is a letter that represents a number. You can choose different numbers for the value of the variable.
For example, in the expression
, the variable is . If the value of is 3, then , because . If the value of is 6, then , because . - vertical angles
- Unit 7 Lesson 3, Unit 7 Lesson 4, Unit 7 Lesson 5
Vertical angles are opposite angles that share the same vertex. They are formed by a pair of intersecting lines. Their angle measures are equal.
For example, angles
and are vertical angles. If angle measure , then angle must also measure . Angles
and are another pair of vertical angles. 
Volume is the number of cubic units that fill a three-dimensional region, without any gaps or overlaps.
For example, the volume of this rectangular prism is 60 units
, because it is composed of 3 layers that are each 20 units . 
- withdrawal
- Unit 5 Lesson 4, Unit 5 Lesson 5, Unit 5 Lesson 6, Unit 5 Lesson 7
When you take money out of an account, it is called a withdrawal.
For example, a person removed
from their bank account. Before the withdrawal, they had . After the withdrawal, they had , because .