Section B: Practice Problems Show Us Your Data
Section Summary
Details
We sorted objects and shapes.

We showed our sorts on paper in different ways.


Problem 1 (Lesson 7)
Here are some objects.

What are 2 categories you can use to sort these objects?
What are 2 different categories you can use to sort these objects?
Problem 2 (Lesson 8)
Here are some objects.
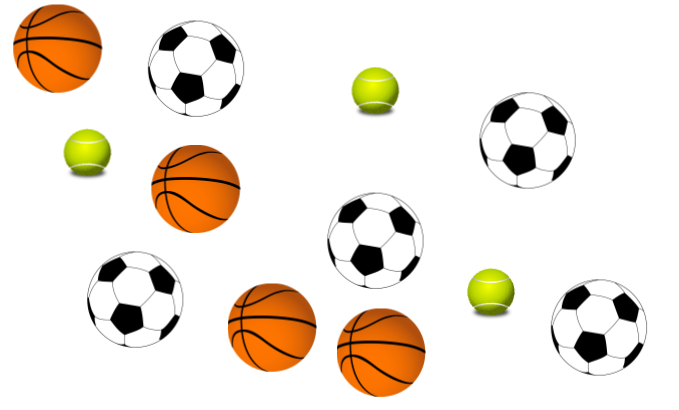
Show how you could sort the balls into categories.
How many balls are in each category?
category 1:
category 2:
category 3:
Problem 3 (Lesson 9)
How are these representations the same? How are they different?


Problem 4 (Exploration)
Gather data from the classroom or home. Sort your data into categories. Show how you sorted the data on paper.
Problem 5 (Exploration)
There are 15 pattern blocks in a bag.
There are squares, triangles, and hexagons.
The chart shows how many squares are in the bag.

How many triangles could be in the bag? How many hexagons could be in the bag?
Find as many solutions as you can.