Section C: Practice Problems What Does the Data Tell Us?
Section Summary
Details
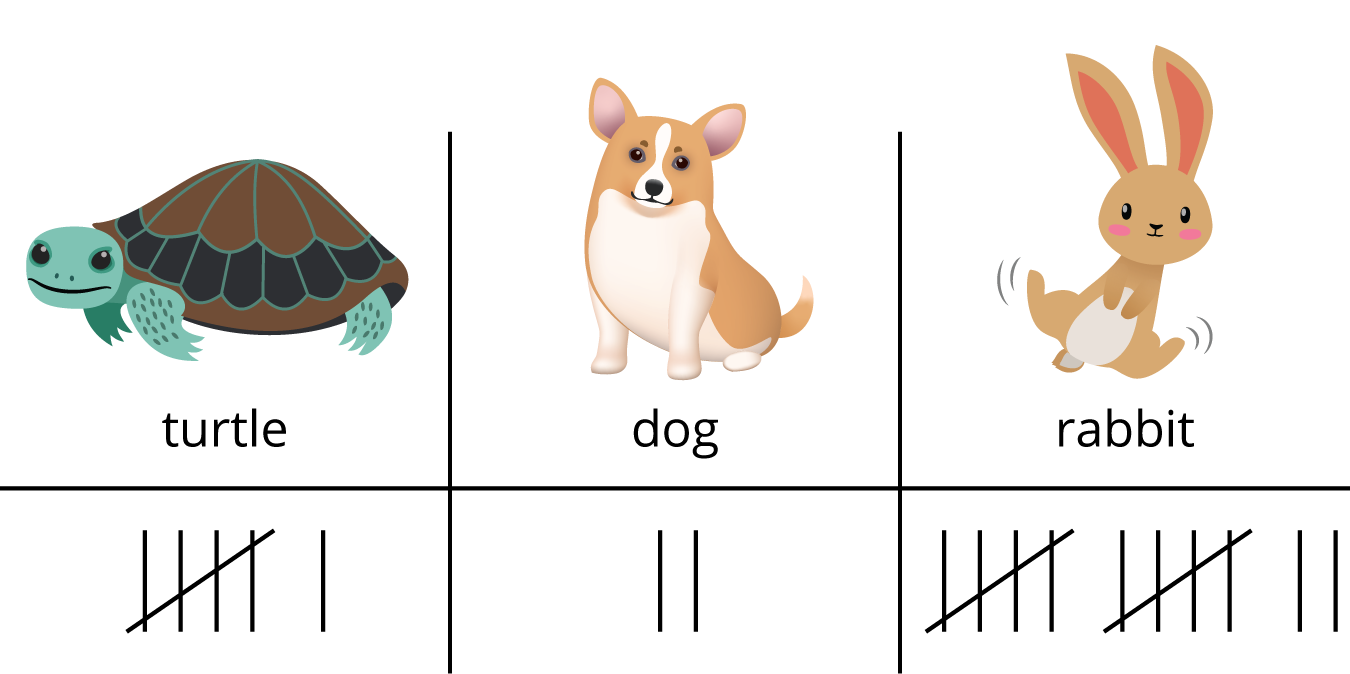
We looked at different ways to show data. You can show data using tally marks.
You can show data using numbers.

We asked and answered questions about data.
How many students want a turtle as a class pet? (6)
How many students want a dog or a rabbit as a class pet? (14)
How many students took the survey? (20)
Think of some questions you can ask your family at home and make a representation to show the data.
Problem 1 (Lesson 11)
Jada showed how she sorted some shapes.

Jada made statements about how she sorted. Decide whether each statement is true or false.
There are 6 triangles.
There are 15 shapes altogether.
The number of shapes that are squares or triangles is the same as the number of circles.


Problem 2 (Lesson 11)
A class was asked about their favorite birds at the zoo. Their responses are shown here.

Write 3 things that you learned about the class’ favorite birds at the zoo.
Problem 3 (Lesson 12)
Use the data to answer the questions.

How many students chose dogs?
How many students chose birds?
How many students chose dogs or cats?
How many students chose cats or birds?
How many students took the survey?
Problem 4 (Lesson 12)
Use the data to answer the questions.

How many students chose yogurt?
How many students chose apple?
How many students chose apple or nuts?
How many students chose apple or yogurt?
How many students took the survey?
Problem 5 (Lesson 13)
Crayons are sorted into categories based on color.

What are 2 questions that you can ask about the crayons?
Problem 6 (Exploration)
Use the data to answer the question.

If the answer to a question about this data is 13, what could the question be?
Problem 7 (Exploration)
Gather data at home or school and make a display of the data.
Ask a math question about the data.
Trade displays and questions with a partner and answer your partner’s question.