Some populations have greater variability than others. For example, we would expect greater variability in the weights of dogs at a dog park than at a beagle meetup.
Dog park: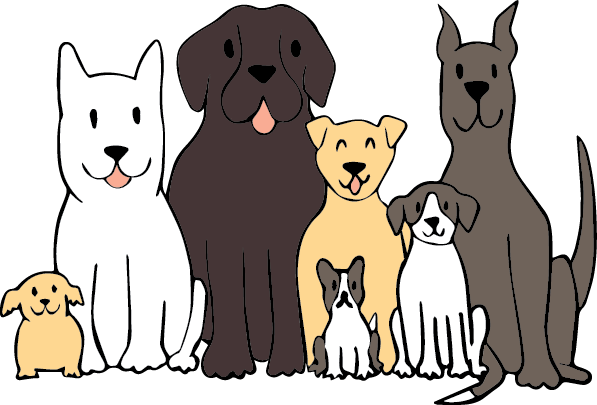
Beagle meetup: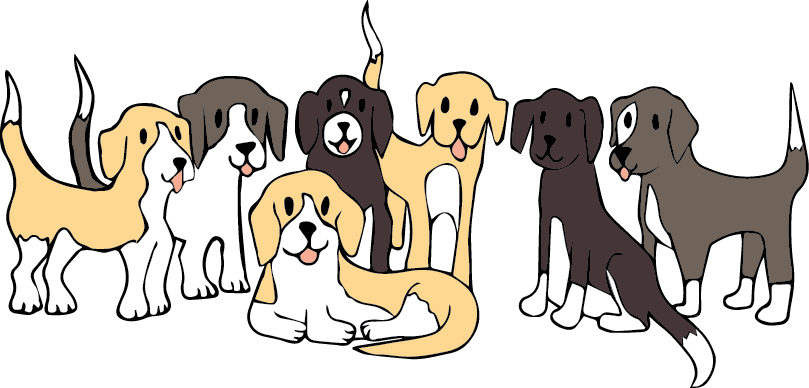
The lower MAD indicates there is less variability in the weights of the beagles. We would expect that the mean weight from a sample that is randomly selected from a group of beagles will provide a more accurate estimate of the mean weight of all the beagles than a sample of the same size from the dogs at the dog park.
In general, a sample of a similar size from a population with less variability is more likely to have a mean that is close to the population mean.