5.1: Which One Doesn’t Belong: Graphs
Which graph doesn’t belong?

Let’s interpret graphs of functions.
Which graph doesn’t belong?
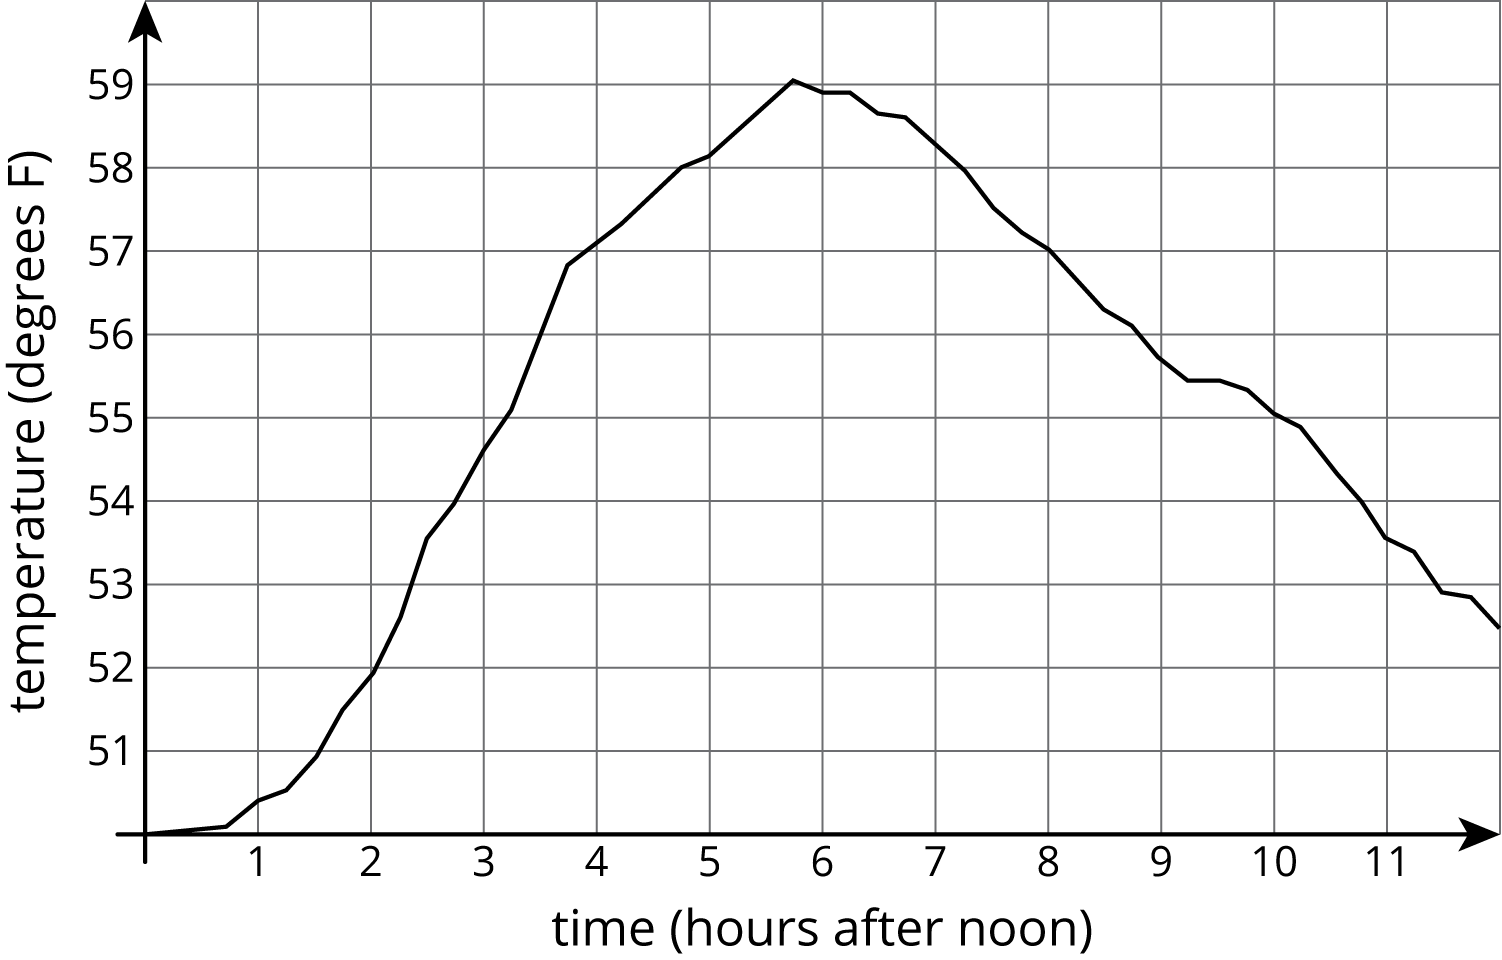
The graph shows the temperature between noon and midnight in one day in a certain city.
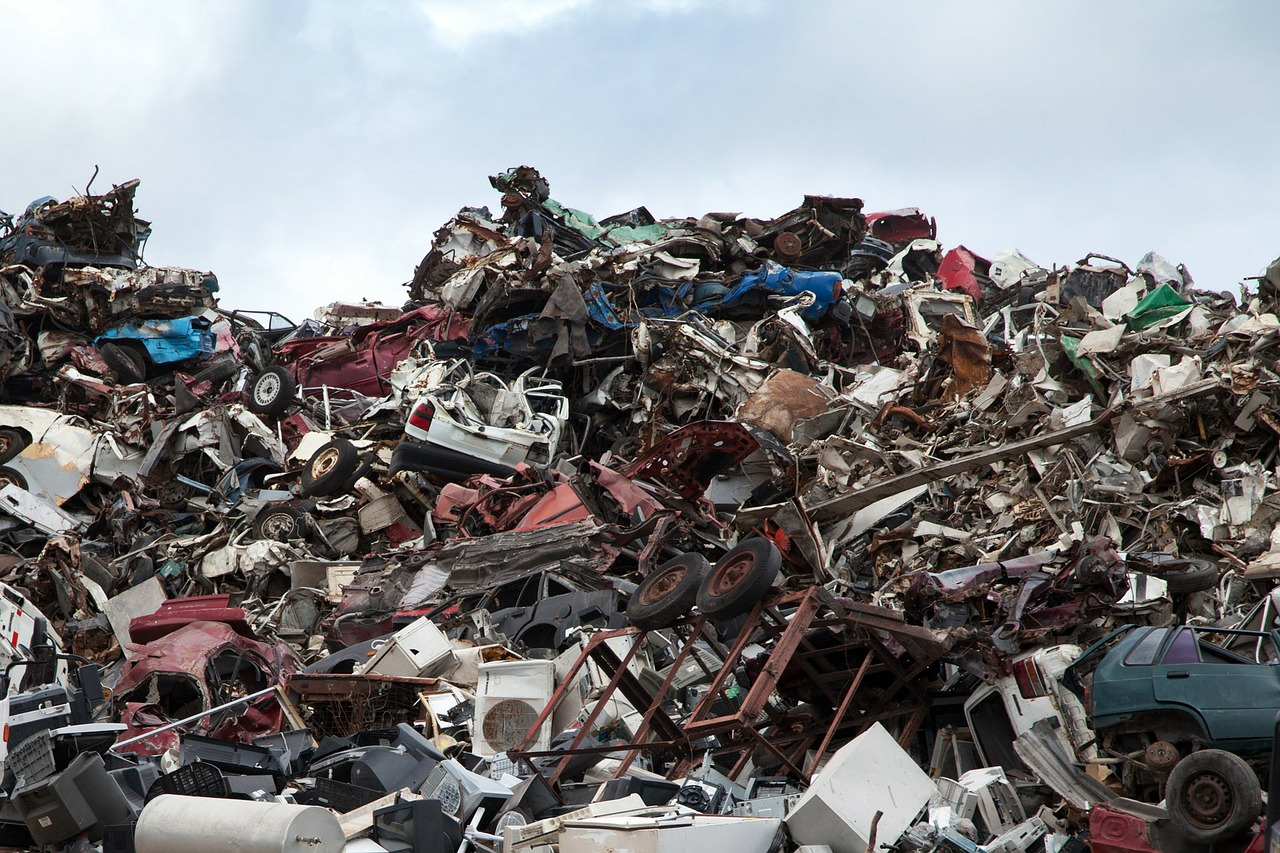 Garbage Dump
Copyright Owner:
PublicDomainPictures
License:
Public Domain
Via:
Pixabay
Garbage Dump
Copyright Owner:
PublicDomainPictures
License:
Public Domain
Via:
Pixabay
Refer to the graph in the first part of the activity.
Here is a graph showing the temperature in a town as a function of time after 8:00 p.m.
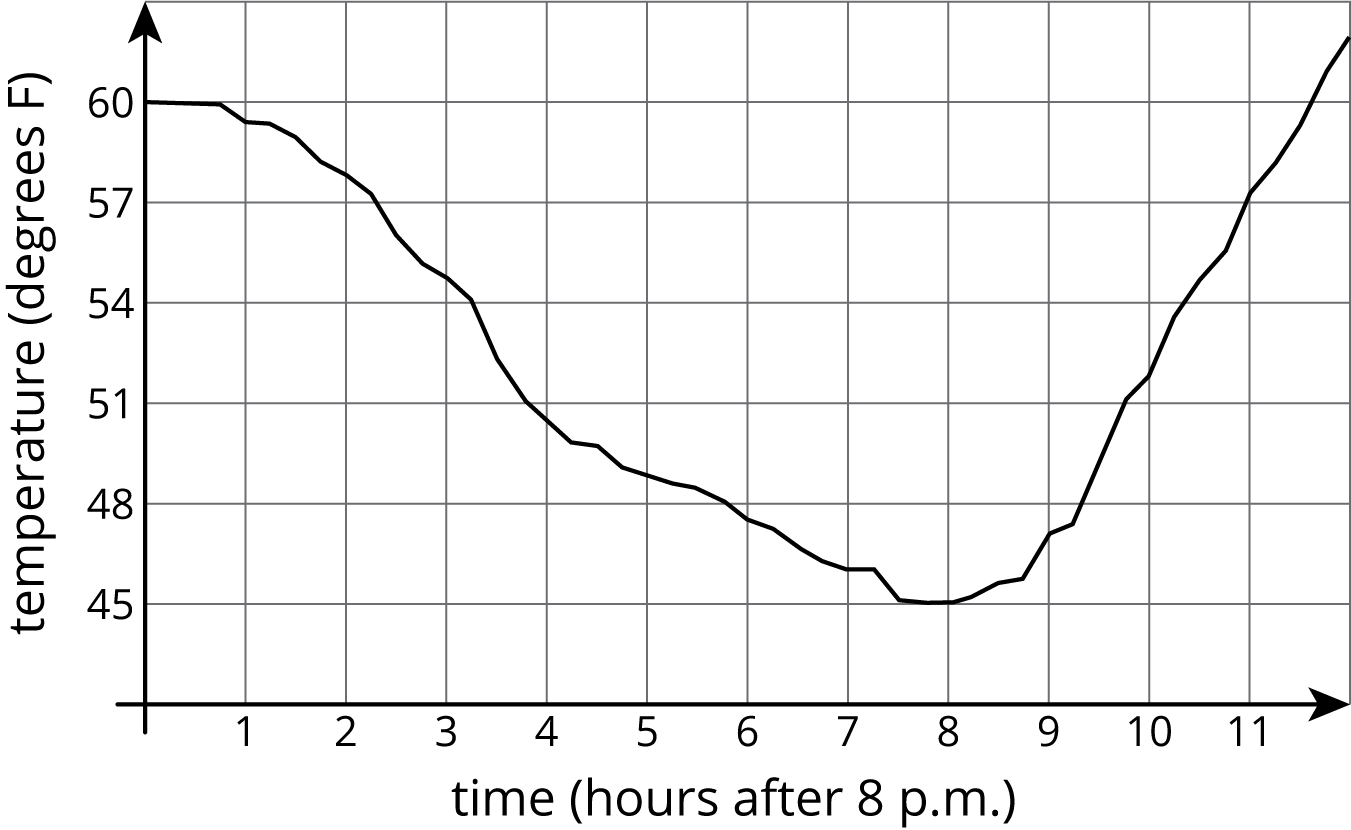
The graph of a function tells us what is happening in the context the function represents. In this example, the temperature starts out at $60^\circ$ F at 8:00 p.m. It decreases during the night, reaching its lowest point at 8 hours after 8:00 p.m., or 4:00 a.m. Then it starts to increase again.