11.1: How Is It Growing?
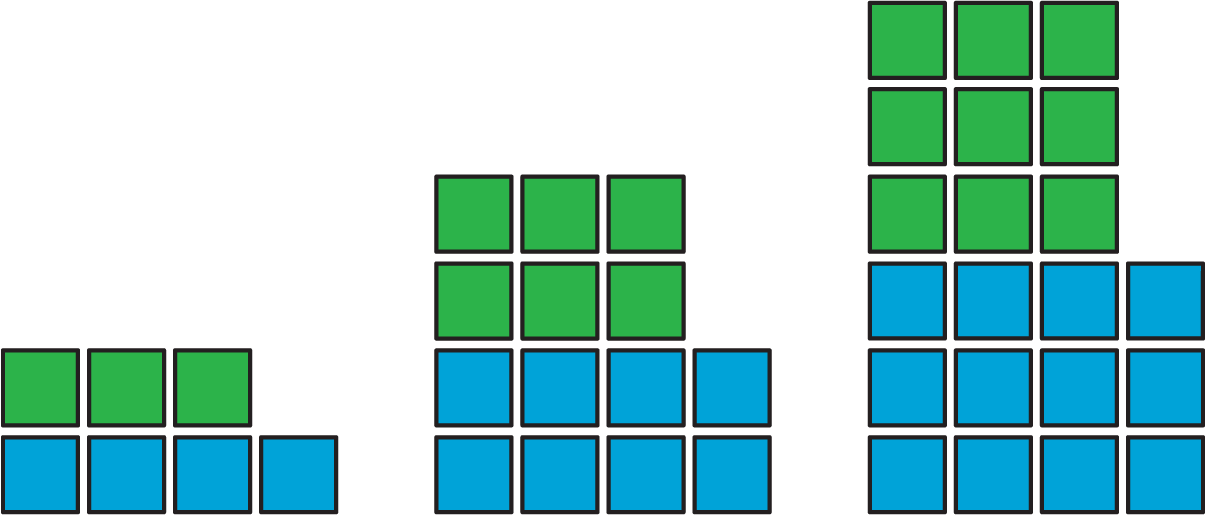
Look for a pattern in the figures.
-
How many total tiles will be in:
- the 4th figure?
- the 5th figure?
- the 10th figure?
-
How do you see it growing?
Let’s use tables to represent equivalent ratios.
Look for a pattern in the figures.
How many total tiles will be in:
How do you see it growing?
Noah’s recipe for one batch of sparkling orange juice uses 4 liters of orange juice and 5 liters of soda water.
A recipe for trail mix says: “Mix 7 ounces of almonds with 5 ounces of raisins.” Here is a table that has been started to show how many ounces of almonds and raisins would be in different-sized batches of this trail mix.
| almonds (oz) | raisins (oz) | |
|---|---|---|
| row 1 | 7 | 5 |
| row 2 | 28 | |
| row 3 | 10 | |
| row 4 | 3.5 | |
| row 5 | 250 | |
| row 6 | 56 |
Complete the table so that ratios represented by each row are equivalent.
You have created a best-selling recipe for chocolate chip cookies. The ratio of sugar to flour is $2:5$.
Create a table in which each entry represents amounts of sugar and flour that might be used at the same time in your recipe.
A table is a way to organize information. Each horizontal set of entries is called a row, and each vertical set of entries is called a column. (The table shown has 2 columns and 5 rows.) A table can be used to represent a collection of equivalent ratios.
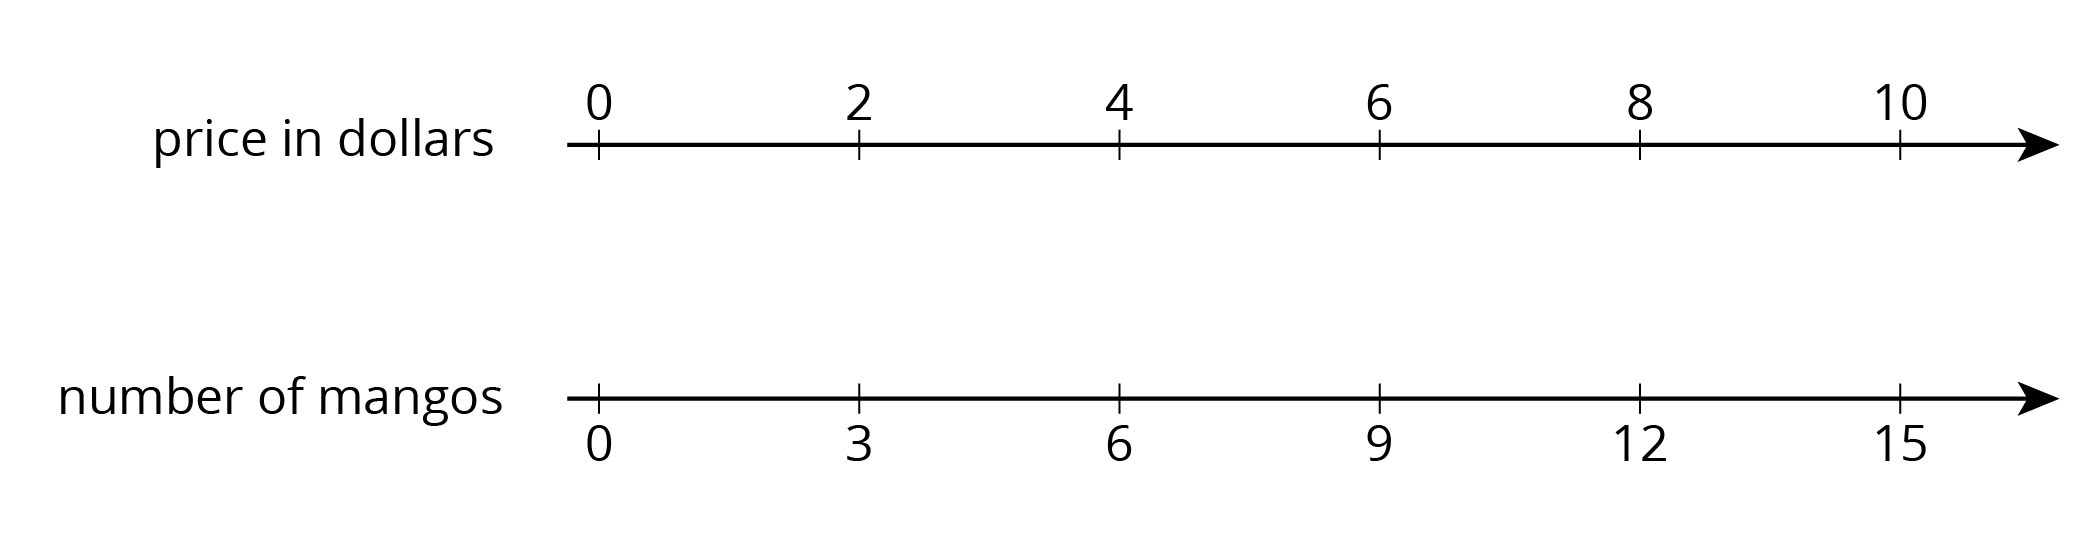
Here is a double number line diagram and a table that both represent the situation: “The price is \$2 for every 3 mangos.”

A table is a way to organize information. Each rectangle in the table is called a cell. Each horizontal set of entries is called a row, and each vertical set of entries is called a column. The first row in a table often contains headers to explain what information is in each column.
This table shows the tail-lengths of three different pets. It has four rows and two columns.
The first cell in each column tells you what kind of information is in that column.
| pet | tail length (inches) |
|---|---|
| dog | 22 |
| cat | 12 |
| mouse | 2 |