1.1: Which Diagram is Which?
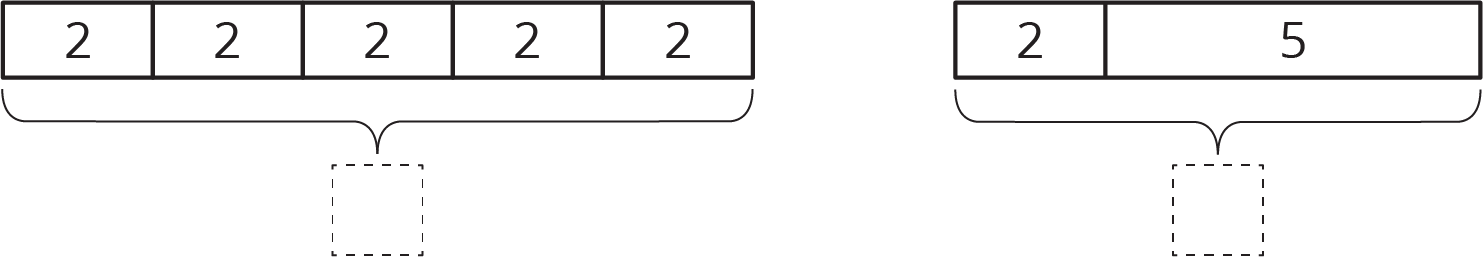
Here are two diagrams. One represents $2+5=7$. The other represents $5 \boldcdot 2=10$. Which is which? Label the length of each diagram.
Draw a diagram that represents each equation.
- $4+3=7$
- $4 \boldcdot 3=12$
Let's see how tape diagrams and equations can show relationships between amounts.
Here are two diagrams. One represents $2+5=7$. The other represents $5 \boldcdot 2=10$. Which is which? Label the length of each diagram.
Here are two tape diagrams. Match each equation to one of the tape diagrams.
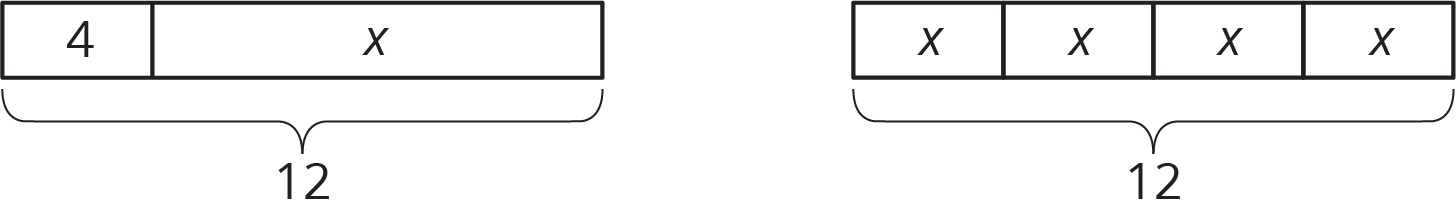
For each equation, draw a diagram and find the value of the unknown that makes the equation true.
You are walking down a road, seeking treasure. The road branches off into three paths. A guard stands in each path. You know that only one of the guards is telling the truth, and the other two are lying. Here is what they say:
Tape diagrams can help us understand relationships between quantities and how operations describe those relationships.
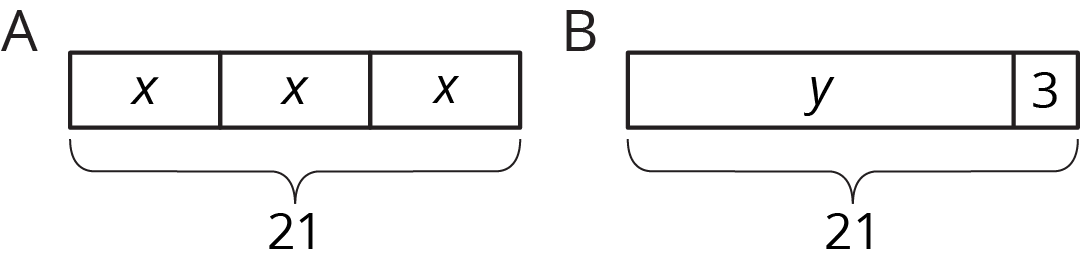
Diagram A has 3 parts that add to 21. Each part is labeled with the same letter, so we know the three parts are equal. Here are some equations that all represent diagram A:
$$x+x+x=21$$ $$3\boldcdot {x}=21$$ $$x=21\div3$$ $$x=\frac13\boldcdot {21}$$
Notice that the number 3 is not seen in the diagram; the 3 comes from counting 3 boxes representing 3 equal parts in 21.
We can use the diagram or any of the equations to reason that the value of $x$ is 7.
Diagram B has 2 parts that add to 21. Here are some equations that all represent diagram B:
$$y+3=21$$ $$y=21-3$$ $$3=21-y$$
We can use the diagram or any of the equations to reason that the value of $y$ is 18.