Lesson 12: Constructing the Coordinate Plane

Let’s investigate different ways of creating a coordinate plane.

12.1: English Winter

 The following data were collected over one December afternoon in England.

  time after
noon (hours)
temperature
($^\circ \text{C}$)
row 1 0 5
row 2 1 3
row 3 2 4
row 4 3 2
row 5 4 1
row 6 5 -2
row 7 6 -3
row 8 7 -4
row 9 8 -4
  1. Which set of axes would you choose to represent these data? Explain your reasoning.
A coordinate plane labeled "A". The origin is  labeled “O”. The horizontal axis is labeled “time after 12 p.m. in hours” and the numbers 0 through 9 are indicated. The vertical axis is labeled “temperature in Celsius” and the numbers 0 through 5 are indicated.
A coordinate plane labeled "B". The origin is labeled “O”. The horizontal axis is labeled “time after 12 p.m. in hours” and the numbers negative 2 through 10, in increments of 2, are indicated. The vertical axis is labeled “temperature in Celsius” and the numbers negative 6 through 8, in increments of 2, are indicated.
  1. Explain why the other two sets of axes did not seem as appropriate as the one you chose.
A coordinate plane labeled "C". The origin is labeled “O”. The horizontal axis is labeled “time after 12 p.m. in hours” and the numbers negative 10 through 40, in increments of 10, are indicated. The vertical axis is labeled “temperature in Celsius” and the numbers negative 20 through 30, in increments of 10, are indicated.

12.2: Axes Drawing Decisions

  1. Here are three sets of coordinates. For each set, draw and label an appropriate pair of axes and plot the points.

    1. $(1, 2), (3, \text-4), (\text-5, \text-2), (0, 2.5)$

      A blank coordinate plane with 16 evenly spaced horizontal units and 12 evenly spaced vertical units.
    2. $(50, 50), (0, 0), (\text-10, \text-30), (\text-35, 40)$

      A blank coordinate plane with 16 evenly spaced horizontal units and 12 evenly spaced vertical units.
    3. $\left(\frac14, \frac34\right), \left(\frac {\text{-}5}{4}, \frac12\right), \left(\text-1\frac14, \frac {\text{-}3}{4}\right), \left(\frac14, \frac {\text{-}1}{2}\right)$

      A blank coordinate plane with 16 evenly spaced horizontal units and 12 evenly spaced vertical units.
  2. Discuss with a partner:

    • How are the axes and labels of your three drawings different?
    • How did the coordinates affect the way you drew the axes and label the numbers?

12.3: Positively A-maze-ing

Here is a maze on a coordinate plane. The black point in the center is (0, 0). The side of each grid square is 2 units long.

GeoGebra Applet EE58262N

  1. Enter the above maze at the location marked with a green segment. Draw line segments to show your way through and out of the maze. Label each turning point with a letter. Then, list all the letters and write their coordinates.
  2. Choose any 2 turning points that share the same line segment. What is the same about their coordinates? Explain why they share that feature.

Summary

The coordinate plane can be used to show information involving pairs of numbers.

When using the coordinate plane, we should pay close attention to what each axis represents and what scale each uses.

Suppose we want to plot the following data about the temperatures in Minneapolis one evening. 

  time
(hours from midnight)
temperature
(degrees C)
row 1 -4 3
row 2 -1 -2
row 3 0 -4
row 4 3 -8

We can decide that the $x$-axis represents number of hours in relation to midnight and the $y$-axis represents temperatures in degrees Celsius.

  • In this case, $x$-values less than 0 represent hours before midnight, and and $x$-values greater than 0 represent hours after midnight.
  • On the $y$-axis, the values represents temperatures above and below the the freezing point of 0 degrees Celsius.

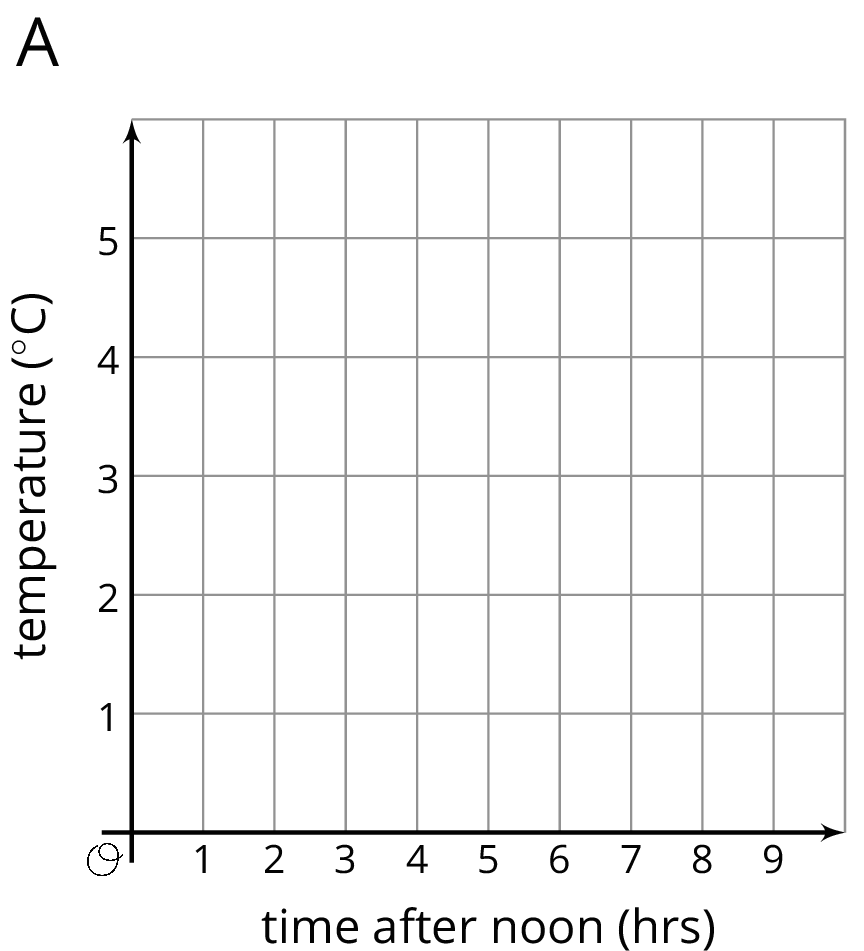
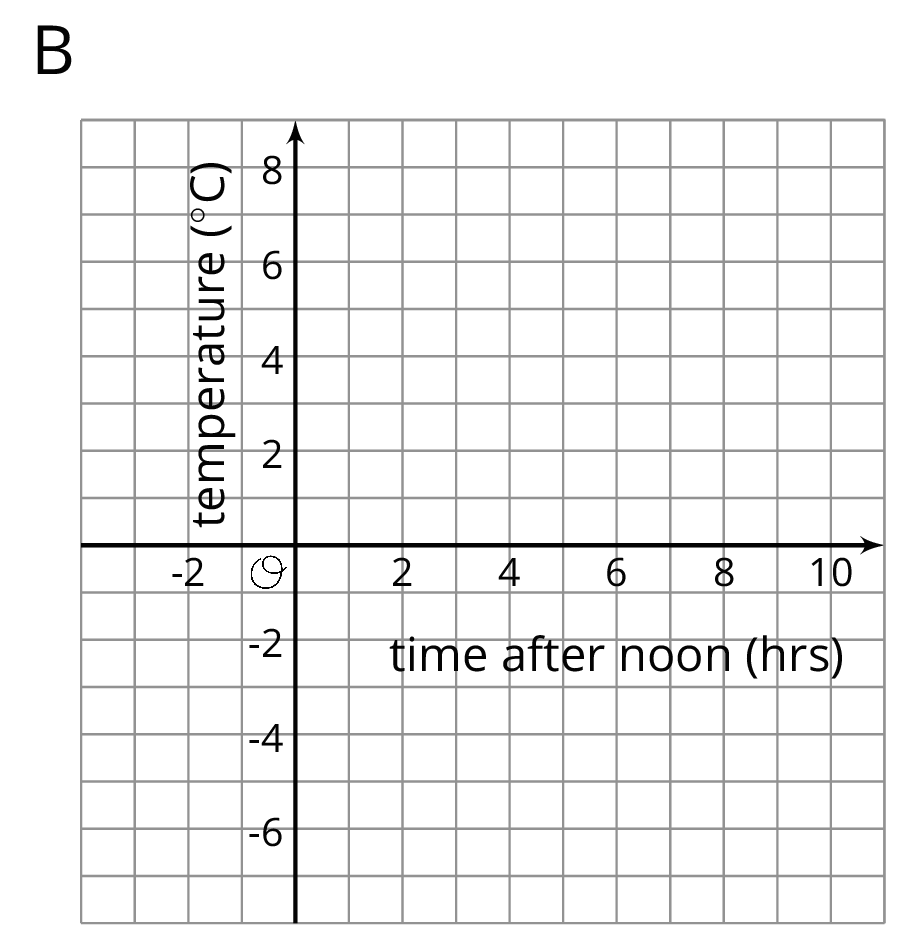
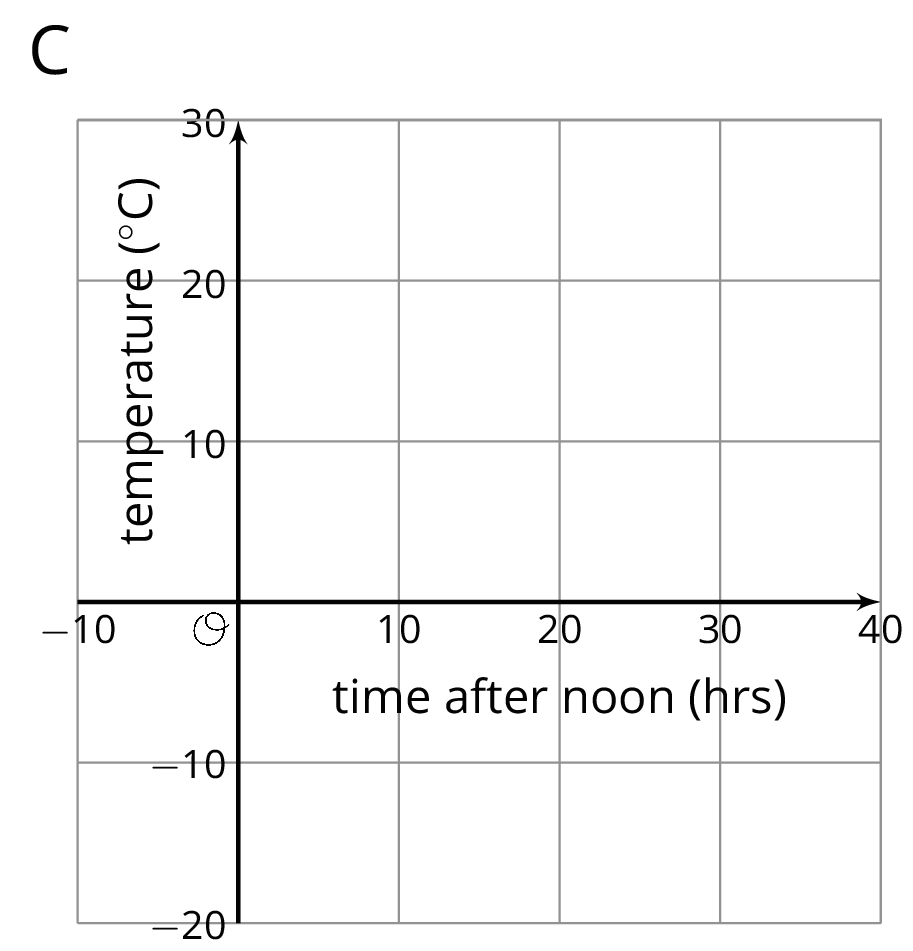
The data involve whole numbers, so it is appropriate that the each square on the grid represents a whole number.

  • On the left of the origin, the $x$-axis needs to go as far as -4 or less (farther to the left). On the right, it needs to go to 3 or greater.
  • Below the origin, the $y$-axis has to go as far as -8 or lower. Above the origin, it needs to go to 3 or higher.

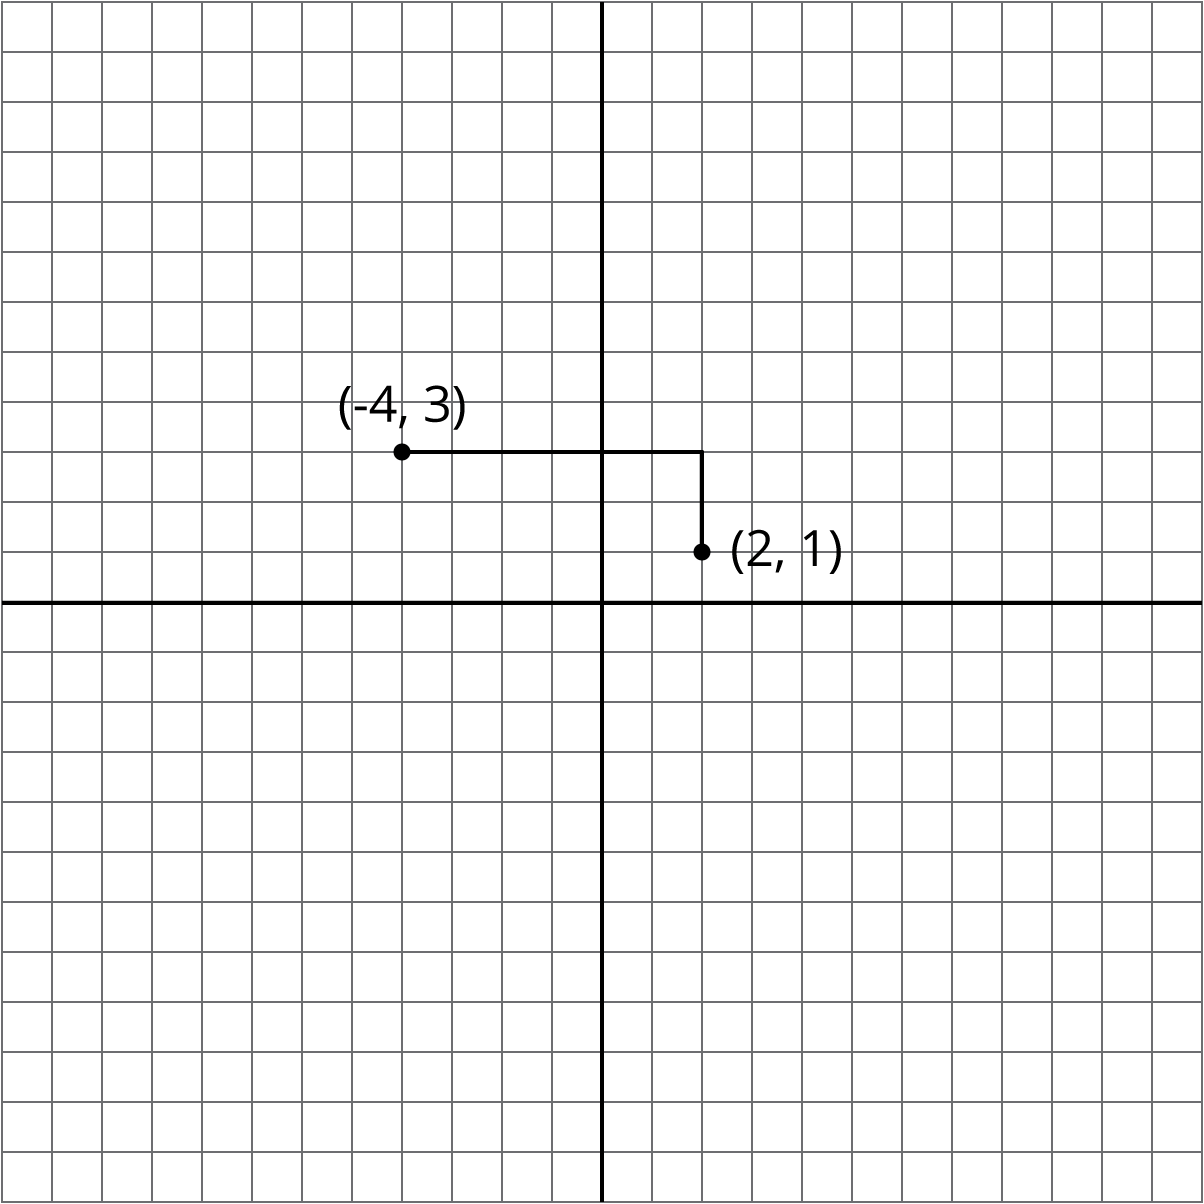
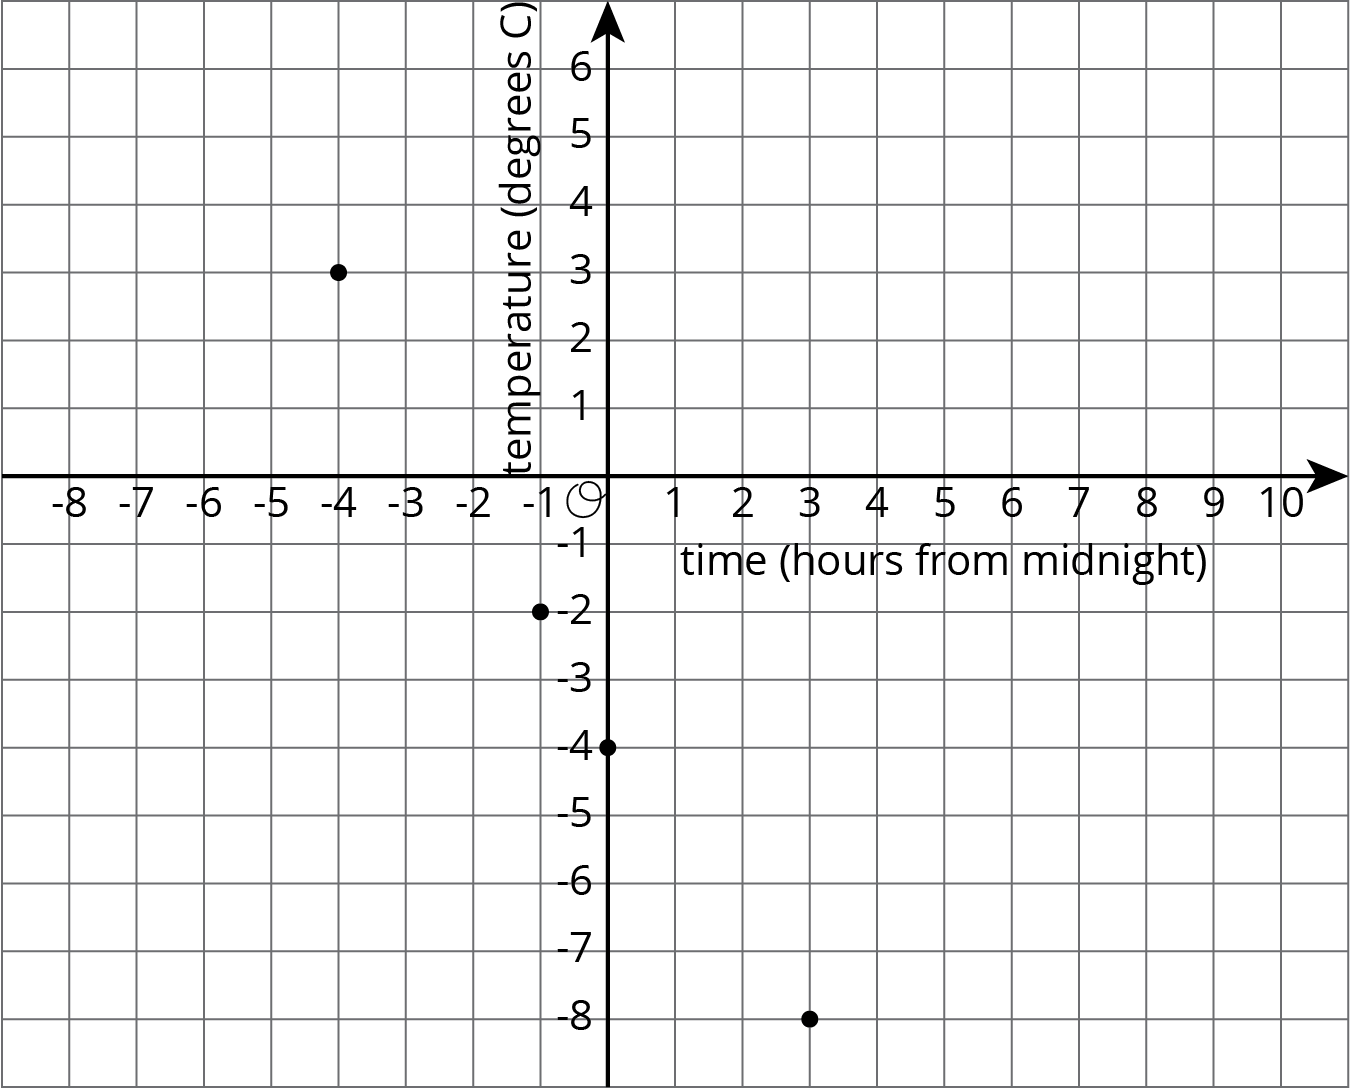
Here is a graph of the data with the axes labeled appropriately. 

On this coordinate plane, the point at $(0, 0)$ means a temperature of 0 degrees Celsius at midnight. The point at $(\text-2, 8)$ means a temperature of 8 degree Celsius at 2 hours before midnight (or 10 p.m.).

Practice Problems ▶