Box plots are useful for comparing different groups. Here are two sets of plots that show the weights of some berries and some grapes.


Notice that the median berry weight is 3.5 grams and the median grape weight is 5 grams. In both cases, the IQR is 1.5 grams. Because the grapes in this group have a higher median weight than the berries, we can say a grape in the group is typically heavier than a berry. Because both groups have the same IQR, we can say that they have a similar variability in their weights.
These box plots represent the length data for a collection ladybugs and a collection of beetles.
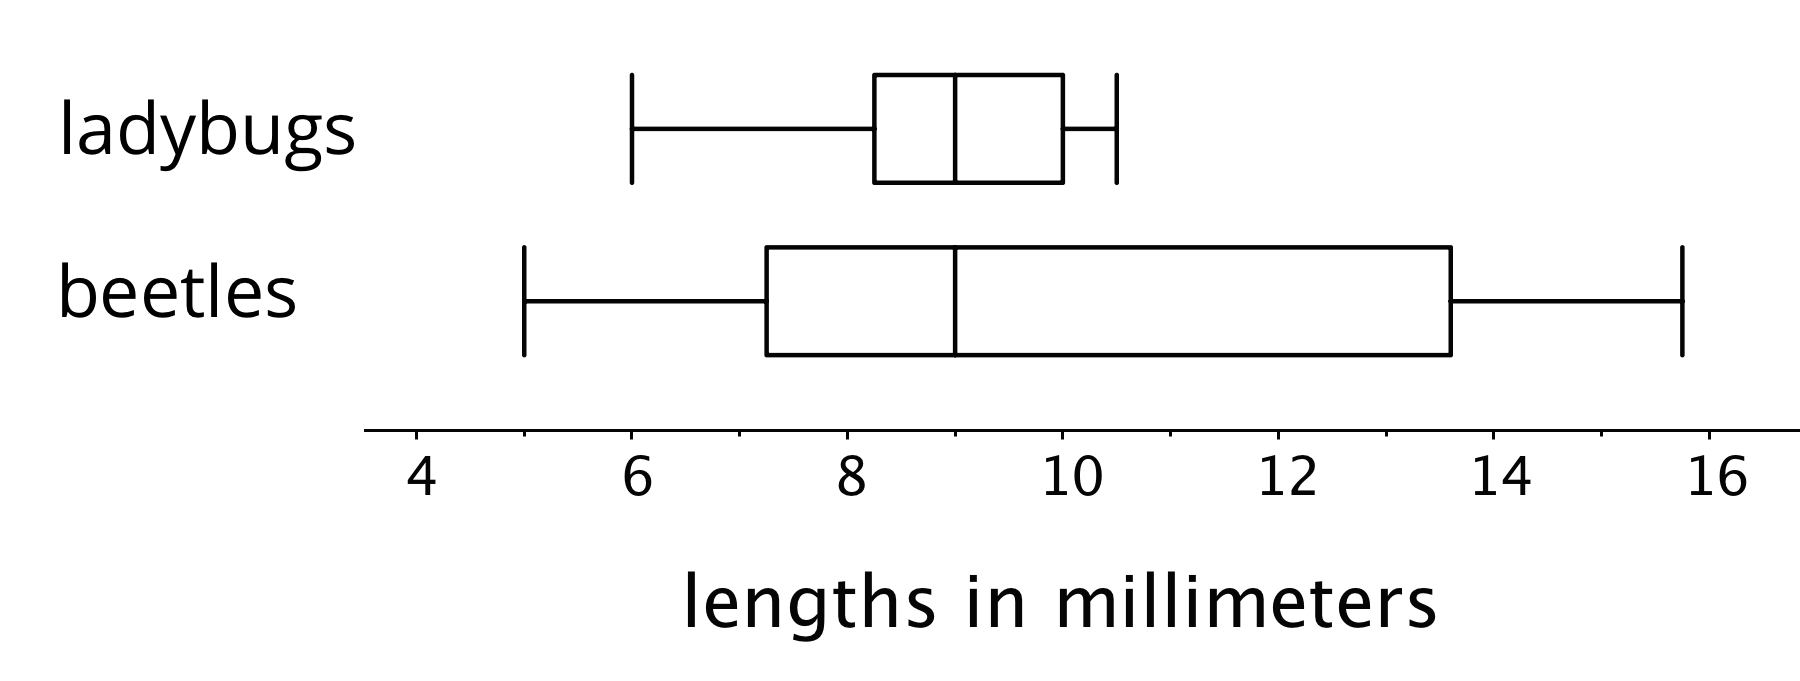
The medians of the two collections are the same, but the IQR of the ladybugs is much smaller. This tells us that a typical ladybug length is similar to a typical beetle length, but the ladybugs are more alike in their length than the beetles are in their length.