Lesson 2: Statistical Questions

Let's look more closely at data and the questions they can help to answer.

2.1: Pencils on A Plot

  1. Measure your pencil to the nearest $\frac14$-inch. Then, plot your measurement on the class dot plot.
  2. What is the difference between the longest and shortest pencil lengths in the class?
  3. What is the most common pencil length?
  4. Find the difference in lengths between the most common length and the shortest pencil.

2.2: What’s in the Data?

Ten sixth-grade students at a school were each asked five survey questions. Their answers to each question are shown here.

data set A 0 1 1 3 0 0 0 2 1 1
data set B 12 12 12 12 12 12 12 12 12 12
data set C 6 5 7 6 4 5 3 4 6 8
data set D 6 6 6 6 6 6 6 6 6 6
data set E 3 7 9 11 6 4 2 16 6 10
  1. Here are the five survey questions. Match each question to a data set that could represent the students’ answers. Explain your reasoning.

    • Question 1: Flip a coin 10 times. How many heads did you get?

      Data set ______ Reason:

    • Question 2: How many books did you read in the last year?

      Data set ______ Reason:

    • Question 3: What grade are you in?

      Data set ______ Reason:

    • Question 4: How many dogs and cats do you have?

      Data set ______ Reason:

    • Question 5: How many inches are in 1 foot?

      Data set ______ Reason:

  2. Discuss with a partner: How are Question 3 and Question 5 different from the other questions?

2.3: What Makes a Statistical Question?

These three questions are examples of statistical questions:

  • What is the most common color of the cars in the school parking lot?
  • What percentage of students in the school have a cell phone?
  • Which kind of literature—fiction or nonfiction—is more popular among students in the school?

These three questions are not examples of statistical questions:

  • What color is the principal’s car?
  • Does Elena have a cell phone?
  • What kind of literature—fiction or nonfiction—does Diego prefer?
  1. Study the examples and non-examples. Discuss with your partner:

    • How are the three statistical questions alike? What do they have in common?
    • How are the three non-statistical questions alike? What do they have in common?
    • How can you find answers to the statistical questions? How about answers to non-statistical questions?
    • What makes a question a statistical question?

    Pause here for a class discussion.

  2. Read each question. Think about the data you might collect to answer it and whether you expect to see variability in the data. Complete each blank with “Yes” or “No.”

    1. How many cups of water do my classmates drink each day?
    • Is variability expected in the data? _______

      Is the question statistical? _______

    1. Where in town does our math teacher live?
    • Is variability expected in the data? _______

      Is the question statistical? _______

    1. How many minutes does it take students in my class to get ready for school in the morning?
    • Is variability expected in the data? _______

      Is the question statistical? _______

    1. How many minutes of recess do sixth-grade students have each day?
    • Is variability expected in the data? _______

      Is the question statistical? _______

    1. Do all students in my class know what month it is?
    • Is variability expected in the data? _______

      Is the question statistical? _______

2.4: Sifting for Statistical Questions

  1. Your teacher will give you and your partner a set of cards with questions. Sort them into three piles: Statistical Questions, Not Statistical Questions, and Unsure.

  2. Compare your sorting decisions with another group of students. Start by discussing the two piles that your group sorted into the Statistical Questions and Not Statistical Questions piles. Then, review the cards in the Unsure pile. Discuss the questions until both groups reach an agreement and have no cards left in the Unsure pile. If you get stuck, think about whether the question could be answered by collecting data and if there would be variability in that data.

  3. Record the letter names of the questions in each pile.

    • Statistical questions: 
    • Non-statistical questions:

Summary

We often collect data to answer questions about something. The data we collect may show variability, which means the data values are not all the same. 

Some data sets have more variability than others. Here are two sets of figures. 

Two sets of figures labeled "A" and "B," such that each set consists of 13 figures. Set A consists of red circles and orange squares. The figures for Set A are as follows: 5 large circles, 1 medium circle, 3 small circles, 2 large squares, 1 medium square, and 1 small square. Set B consists of red circles, orange squares, green triangles, and blue rectangles. The figures for Set B are as follows: 1 extra-large circle, 1 large circle, 1 medium circle, 1 small circle, 1 large suare, 1 medium square, 1 small square, 1 large triangle, 1 medium triangle, 1 small triangle, 1 large rectangle, 1 medium rectangle, and 1 small rectangle.

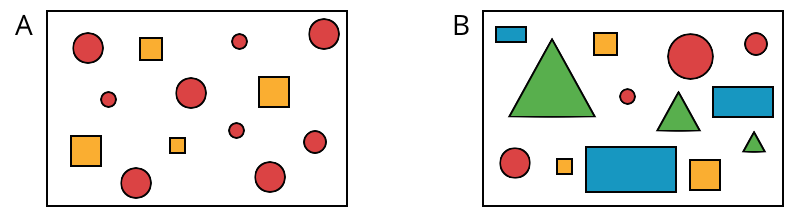
Set A has more figures with the same shape, color, or size. Set B shows more figures with different shapes, colors, or sizes, so set B has greater variability than set A.

Both numerical and categorical data can show variability. Numerical sets can contain different numbers, and categorical sets can contain different categories or types.

When a question can only be answered by using data and we expect that data to have variability, we call it a statistical question. Here are some examples.

  • Who is the most popular musical artist at your school?
  • When do students in your class typically eat dinner?
  • Which classroom in your school has the most books?

To answer the question about books, we may need to count all of the books in each classroom of a school. The data we collect would likely show variability because we would expect each classroom to have a different number of books. 

In contrast, the question “How many books are in your classroom?” is not a statistical question. If we collect data to answer the question (for example, by asking everyone in the class to count books), the data can be expected to show the same value. Likewise, if we ask all of the students at a school where they go to school, that question is not a statistical question because the responses will all be the same.

Practice Problems ▶

Glossary

variability

variability

Variability is the tendency of a data set to have different data values.

statistical question

statistical question

A statistical question is a question that can only be answered by using data and where we expect the data to have variability.