13.1: Number Talk: Constant Dividend
-
Find the quotients mentally.
$150\div 2$
$150\div 4$
$150\div 8$
- Locate and label the quotients on the number line.
Let’s contrast double number lines and tables.
Find the quotients mentally.
$150\div 2$
$150\div 4$
$150\div 8$
The other day, we saw that Han can run 100 meters in 20 seconds.
Han wonders how long it would take him to run 3,000 meters at this rate. He made a table of equivalent ratios.
| row 1 | 20 | 100 |
|---|---|---|
| row 2 | 10 | 50 |
| row 3 | 1 | 5 |
| row 4 | 3,000 |
| row 1 | ||
|---|---|---|
| row 2 | ||
| row 3 | ||
| row 4 | ||
| row 5 |
Priya’s neighbor has a dirt bike that can go 360 meters in 15 seconds. At this rate, how long would it take them to ride 3,000 meters?
The International Space Station orbits around the Earth at a constant speed. Your teacher will give you either a double number line or a table that represents this situation. Your partner will get the other representation.
 International Space Station
Copyright Owner:
NASA
License:
Public Domain
Via:
NASA
International Space Station
Copyright Owner:
NASA
License:
Public Domain
Via:
NASA
On a double number line diagram, we put labels in front of each line to tell what the numbers represent. On a table, we put labels at the top of each column to tell what the numbers represent.
Here are two different ways we can represent the situation: “A snail is moving at a constant speed down a sidewalk, traveling 6 centimeters per minute.”
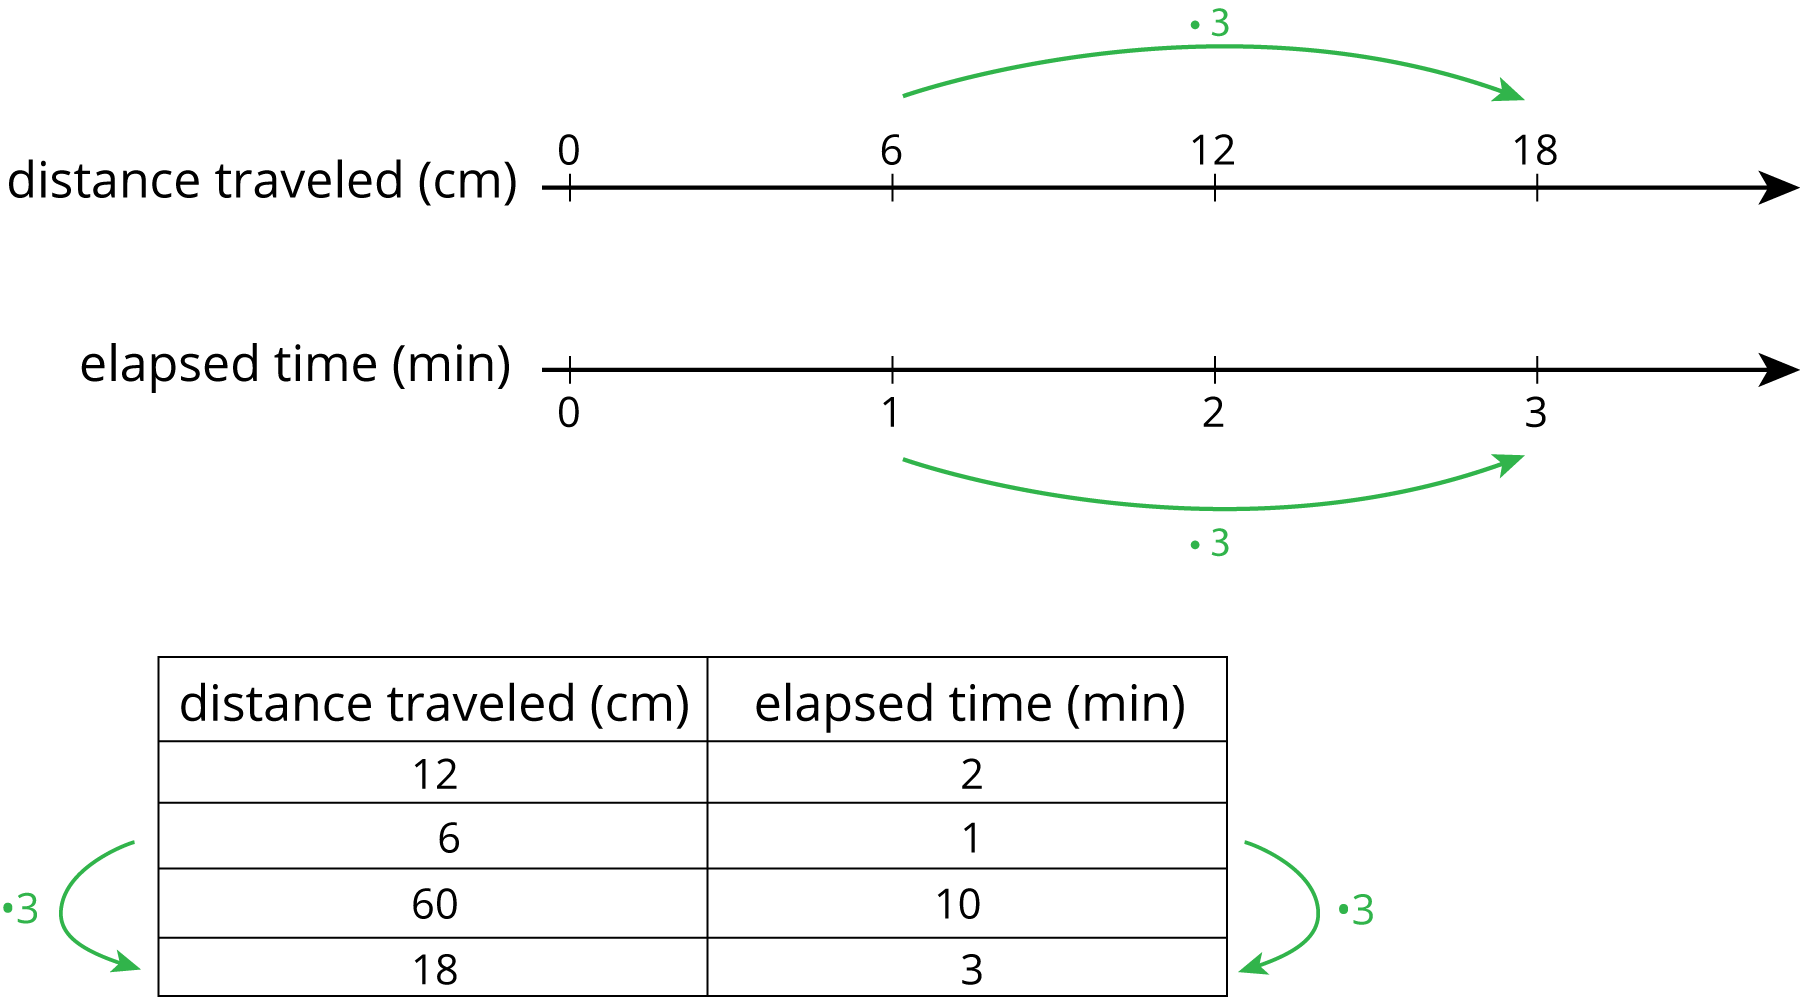
Both double number lines and tables can help us use multiplication to make equivalent ratios, but there is an important difference between the two representations.
On a double number line, the numbers on each line are listed in order. With a table, you can write the ratios in any order. For this reason, sometimes a table is easier to use to solve a problem.
For example, what if we wanted to know how far the snail travels in 10 minutes? Notice that 60 centimeters in 10 minutes is shown on the table, but there is not enough room for this information on the double number line.