16.1: Which One Would You Choose?
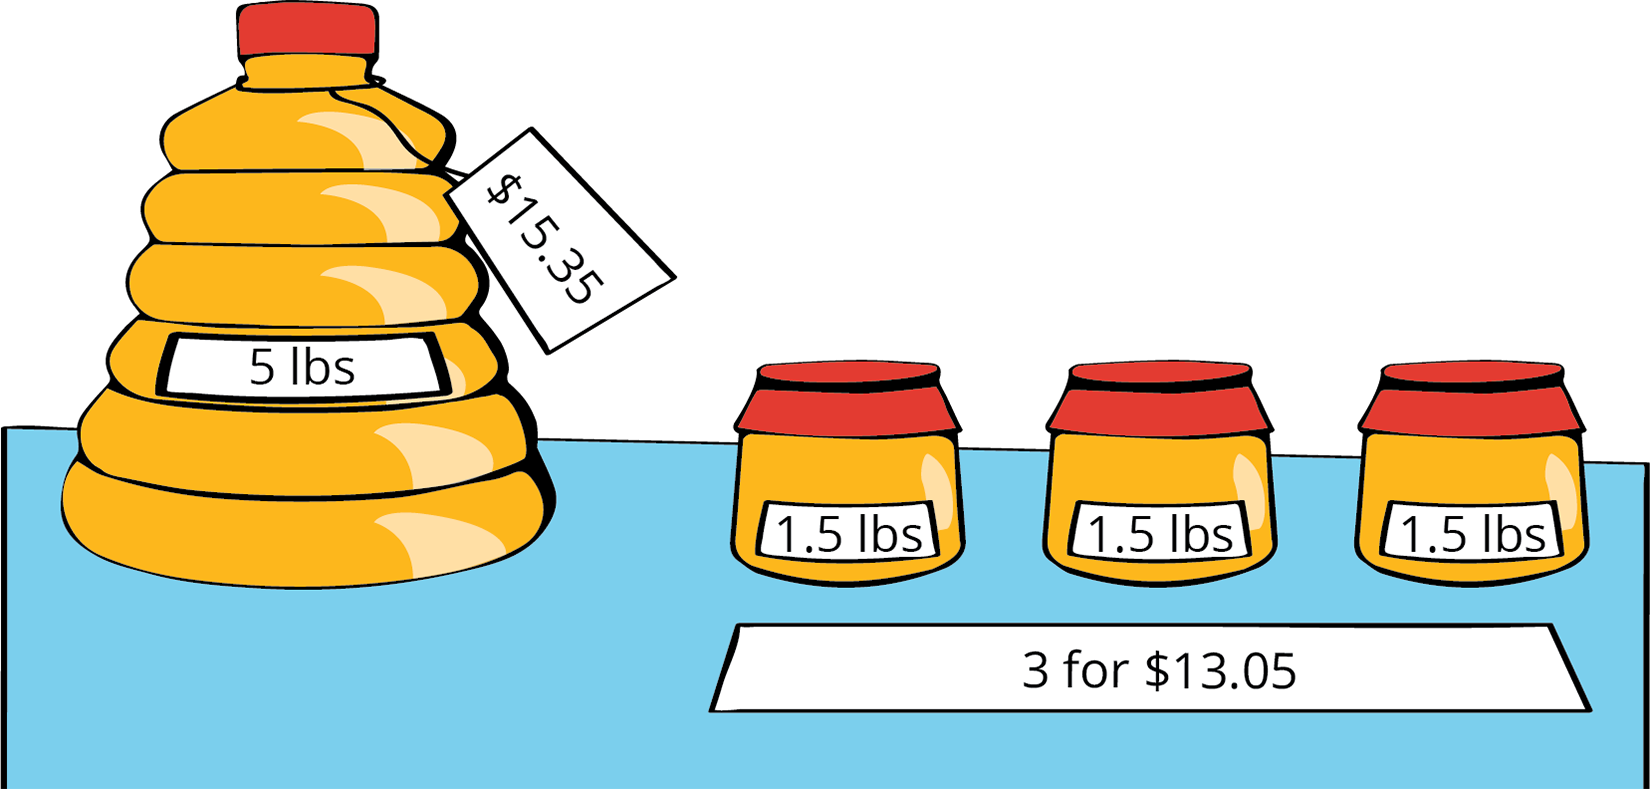
Which one would you choose? Be prepared to explain your reasoning.
- A 5-pound jug of honey for \$15.35
- Three 1.5-pound jars of honey for \$13.05
Let’s use equations and graphs to describe relationships with ratios.
Which one would you choose? Be prepared to explain your reasoning.
Lin needs to mix a specific color of paint for the set of the school play. The color is a shade of orange that uses 3 parts yellow for every 2 parts red.
Complete the table to show different combinations of red and yellow paint that will make the shade of orange Lin needs.
| row 1 | cups of red paint $(r)$ | cups of yellow paint $(y)$ | total cups of paint $(t)$ |
|---|---|---|---|
| row 2 | 2 | 3 | |
| row 3 | 6 | ||
| row 4 | 20 | ||
| row 5 | 18 | ||
| row 6 | 14 | ||
| row 7 | 16 | ||
| row 8 | 50 | ||
| row 9 | 42 |
Lin notices that the number of cups of red paint is always $\frac25$ of the total number of cups. She writes the equation $r=\frac25 t$ to describe the relationship. Which is the independent variable? Which is the dependent variable? Explain how you know.
Write an equation that describes the relationship between $r$ and $y$ where $y$ is the independent variable.
Write an equation that describes the relationship between $y$ and $r$ where $r$ is the independent variable.
Use the points in the table to create two graphs that show the relationship between $r$ and $y$. Match each relationship to one of the equations you wrote.
Equations are very useful for describing sets of equivalent ratios. Here is an example.
A pie recipe calls for 3 green apples for every 5 red apples. We can create a table to show some equivalent ratios.
| green apples (g) | red apples (r) | |
|---|---|---|
| row 1 | 3 | 5 |
| row 2 | 6 | 10 |
| row 3 | 9 | 15 |
| row 4 | 12 | 20 |
We can see from the table that $r$ is always $\frac53$ as large as $g$ and that $g$ is always $\frac35$ as large as $r$. We can write equations to describe the relationship between $g$ and $r$.
When we know the number of green apples and want to find the number of red apples, we can write: $$r=\frac53g$$ In this equation, if $g$ changes, $r$ is affected by the change, so we refer to $g$ as the independent variable and $r$ as the dependent variable.
We can use this equation with any value of $g$ to find $r$. If 270 green apples are used, then $\frac53 \boldcdot (270)$ or 450 red apples are used.
When we know the number of red apples and want to find the number of green apples, we can write: $$g=\frac35r$$ In this equation, if $r$ changes, $g$ is affected by the change, so we refer to $r$ as the independent variable and $g$ as the dependent variable.
We can use this equation with any value of $r$ to find $g$. If 275 red apples are used, then $\frac35 \boldcdot (275)$ or 165 green apples are used.
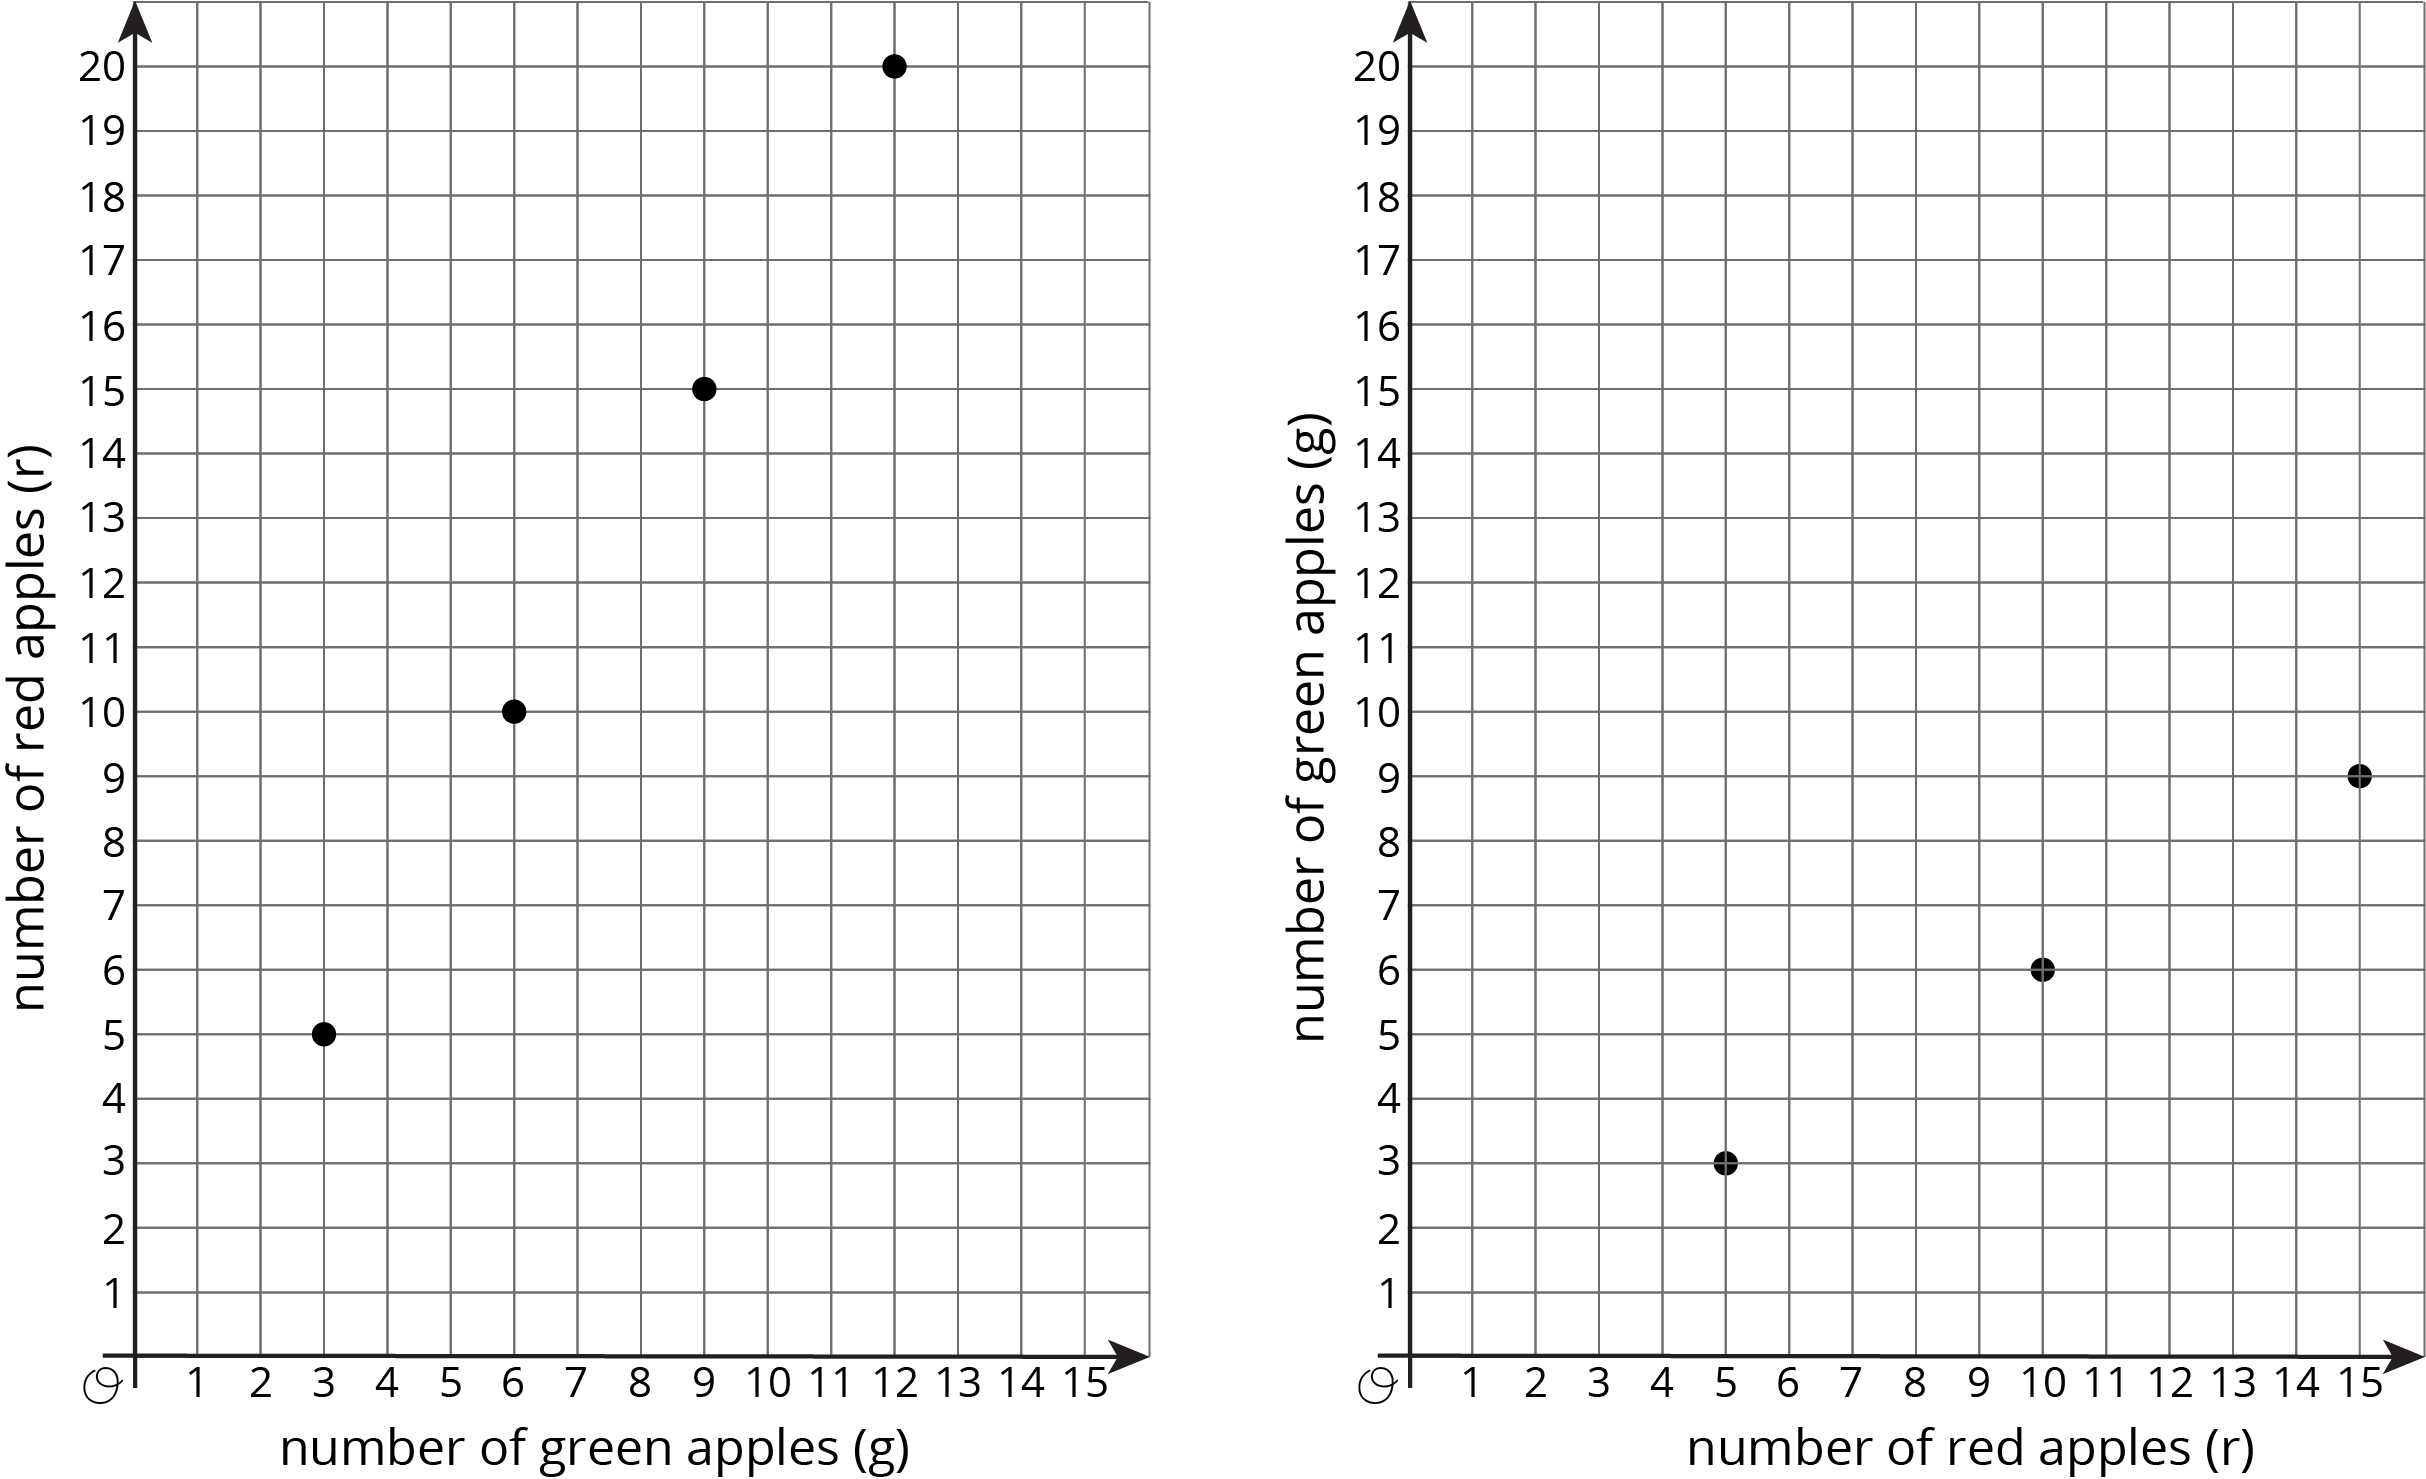
We can also graph the two equations we wrote to get a visual picture of the relationship between the two quantities.
A variable representing the output of a function.
A variable representing the input of a function.