Lesson 17: Two Related Quantities, Part 2

Let’s use equations and graphs to describe stories with constant speed.

17.1: Walking to the Library

Lin and Jada each walk at a steady rate from school to the library. Lin can walk 13 miles in 5 hours, and Jada can walk 25 miles in 10 hours. They each leave school at 3:00 and walk $3\frac14$ miles to the library. What time do they each arrive?

17.2: The Walk-a-thon

Diego, Elena, and Andre participated in a walk-a-thon to raise money for cancer research. They each walked at a constant rate, but their rates were different.

  1. Complete the table to show how far each participant walked during the walk-a-thon.
    row 1 time in hours miles walked
    by Diego
    miles walked
    by Elena
    miles walked
    by Andre
    row 2 1      
    row 3 2 6    
    row 4   12 11  
    row 5 5     17.5
  1. How fast was each participant walking in miles per hour?
  1. How long did it take each participant to walk one mile?
  1. Graph the progress of each person in the coordinate plane. Use a different color for each participant.

GeoGebra Applet aCRt6bAF

  1. Diego says that $d=3t$ represents his walk, where $d$ is the distance walked in miles and $t$ is the time in hours.

    1. Explain why $d=3t$ relates the distance Diego walked to the time it took.
    2. Write two equations that relate distance and time: one for Elena and one for Andre.
  2. Use the equations you wrote to predict how far each participant would walk, at their same rate, in 8 hours.
  3. For Diego’s equation and the equations you wrote, which is the dependent variable and which is the independent variable?

Summary

Equations are very useful for solving problems with constant speeds. Here is an example.

A boat is traveling at a constant speed of 25 miles per hour.

  1. How far can the boat travel in 3.25 hours?
  2. How long does it take for the boat to travel 60 miles?

We can write equations to help us answer questions like these. Let's use $t$ to represent the time in hours and $d$ to represent the distance in miles that the boat travels. 

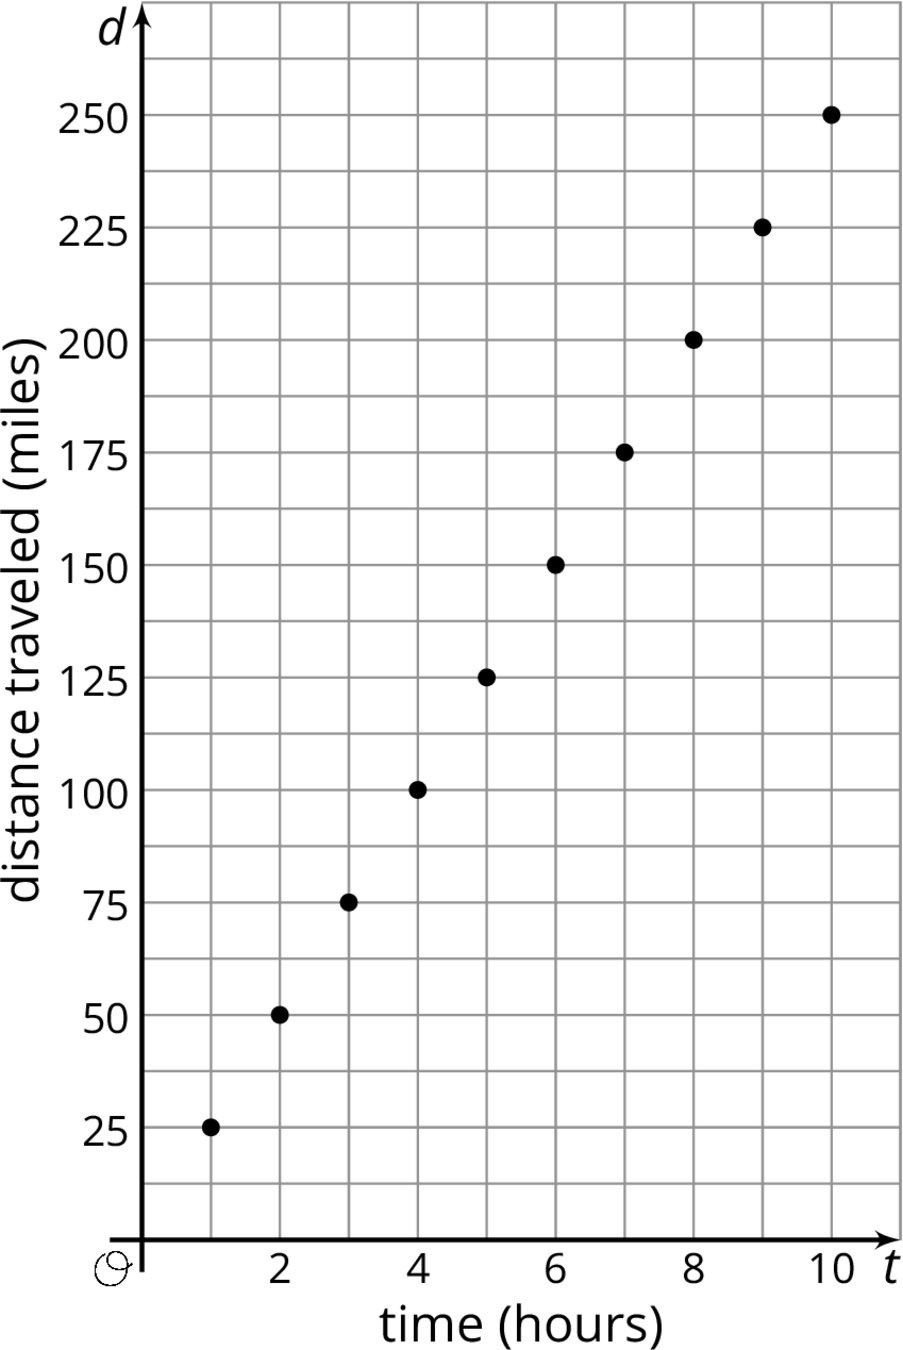
  1. When we know the time and want to find the distance, we can write: $$d = 25t$$
    In this equation, if $t$ changes, $d$ is affected by the change, so we $t$ is the independent variable and $d$ is the dependent variable.

    This equation can help us find $d$ when we have any value of $t$. In $3.25$ hours, the boat can travel $25(3.25)$ or $81.25$ miles.

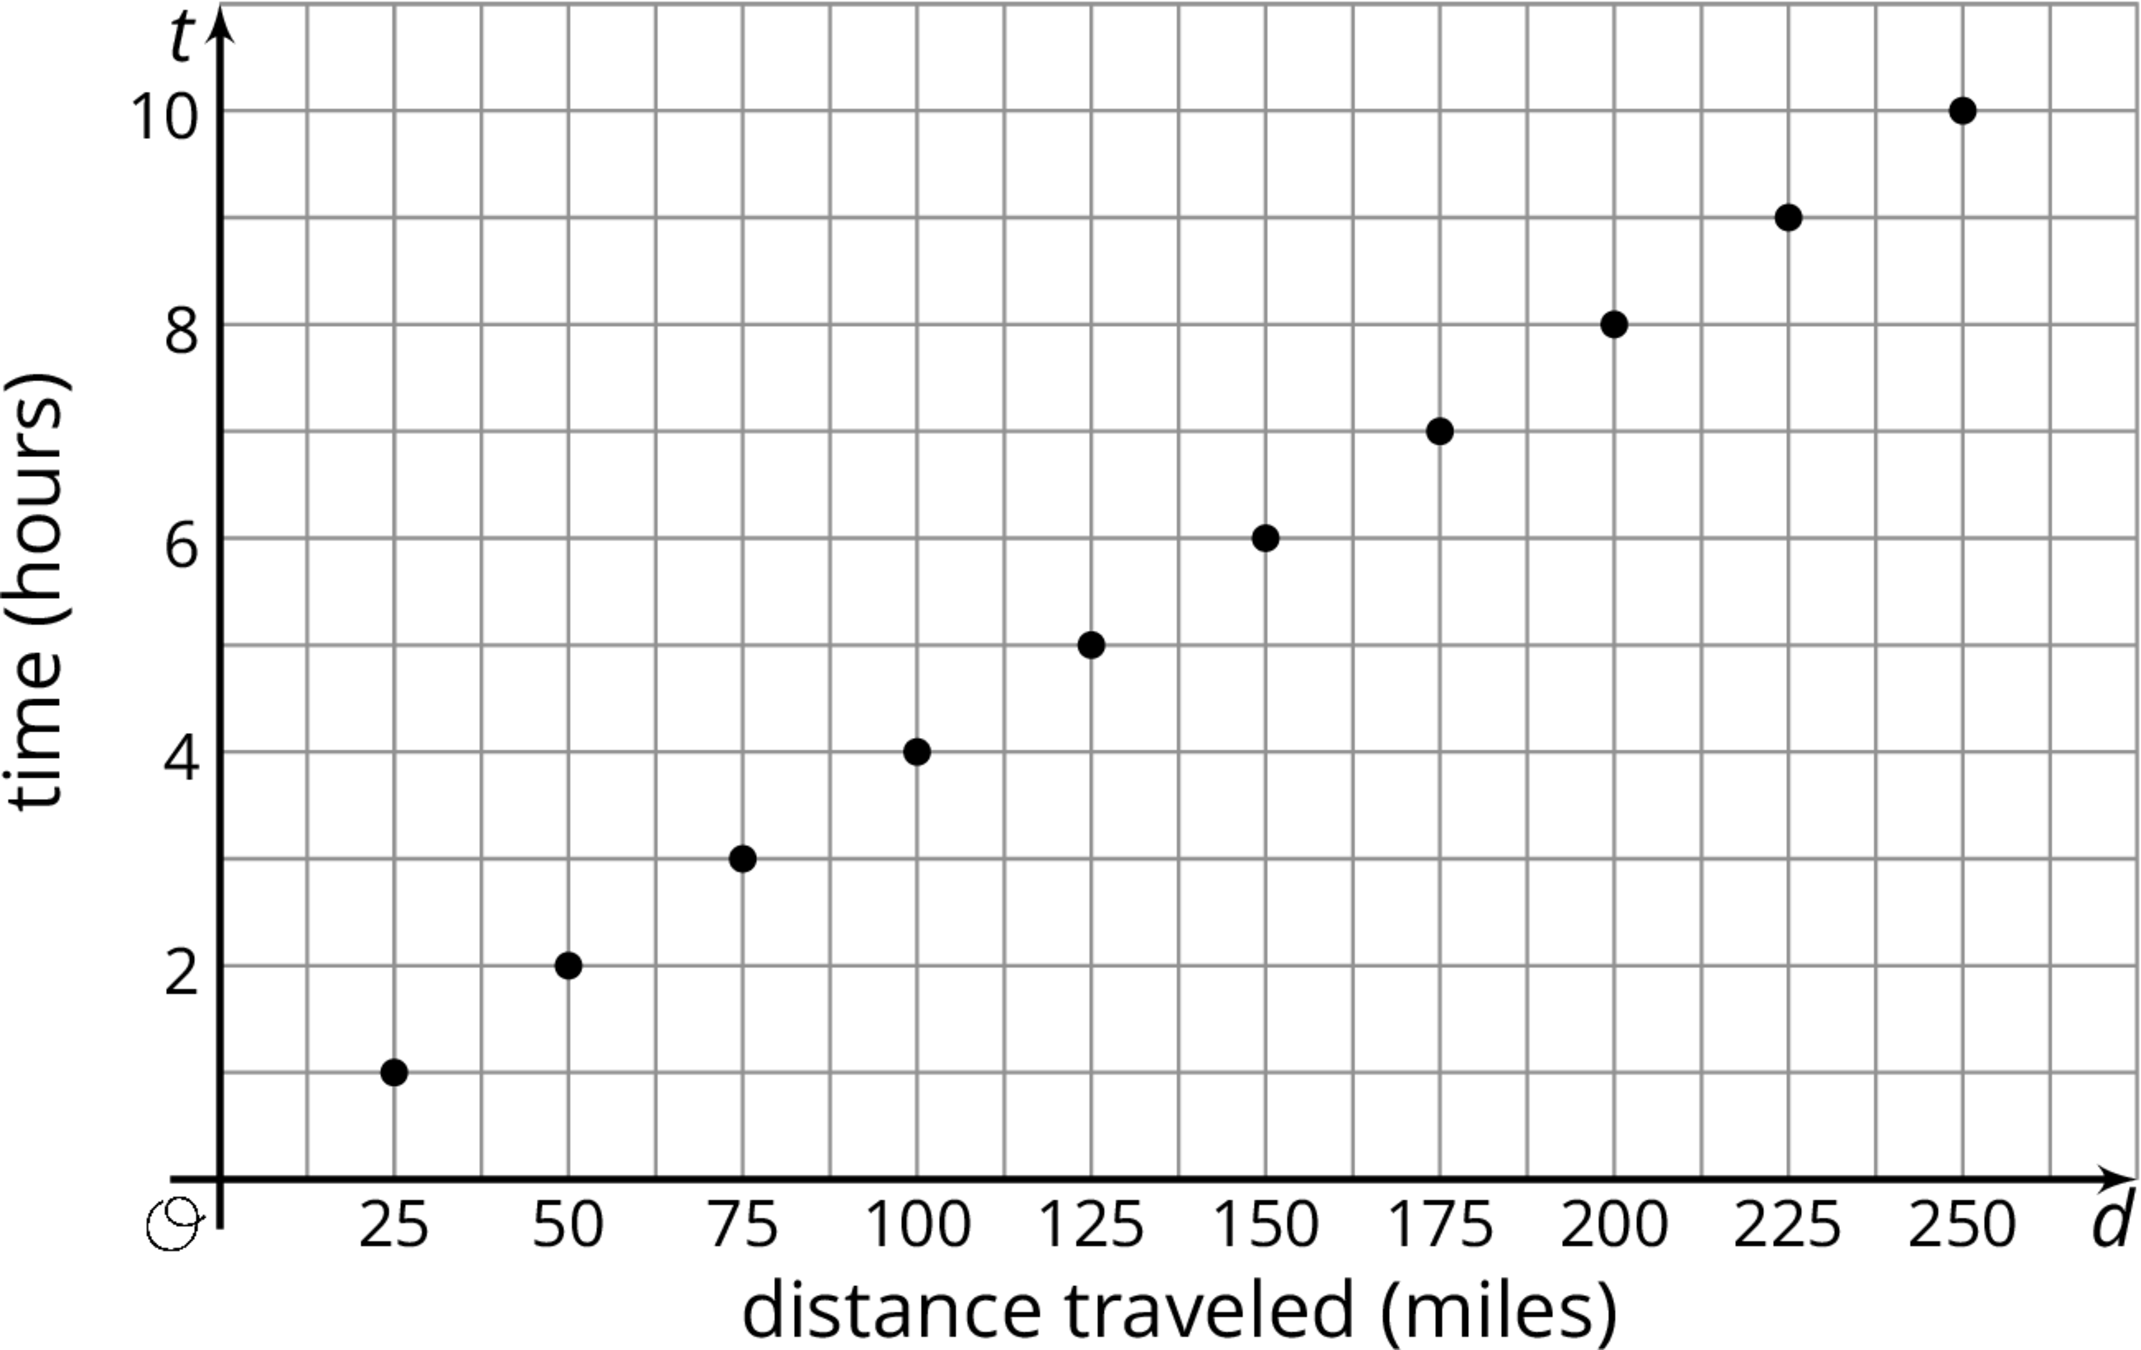
  1. When we know the distance and want to find the time, we can write: $$t = \frac{d}{25}$$ In this equation, if $d$ changes, $t$ is affected by the change, so we $d$ is the independent variable and $t$ is the dependent variable.

    This equation can help us find $t$ when for any value of $d$. To travel 60 miles, it will take $\frac{60}{25}$ or $2 \frac{2}{5}$ hours.

These problems can also be solved using important ratio techniques such as a table of equivalent ratios. The equations are particularly valuable in this case because the answers are not round numbers or easy to quickly evaluate.

We can also graph the two equations we wrote to get a visual picture of the relationship between the two quantities:


A graph of 10 points plotted in the coordinate plane with the origin labeled "O". The horizontal t axis is labeled "time in hours". The numbers 0 through 10, in increments of 2, are indicated, and there are vertical gridlines midway between. The vertical axis is labeled "distance traveled in miles". The numbers 0 through 250, in increments of 25, are indicated, and there are horizontal gridlines midway between. The data are as follows: 1 comma 25. 2 comma 50. 3 comma 75. 4 comma 100. 5 comma 125. 6 comma 150. 7 comma 175. 8 comma 200. 9 comma 225. 10 comma 250.

A graph of 10 points plotted on the coordinate plane with the origin labeled "O". The horizontal d axis is labeled "distance traveled in miles". The numbers 0 through 250, in increments of 25, are indicated, and there are vertical gridlines midway between. The vertical t axis is labeled "time in hours". The numbers 0 through 10, in increments of 2, are indicated, and there are horizontal gridlines midway between. The data are as follows: 25 comma 1. 50 comma 2. 75 comma 3. 100 comma 4. 125 comma 5. 150 comma 6. 175 comma 7. 200 comma 8. 225 comma 9. 250 comma 10.

Practice Problems ▶