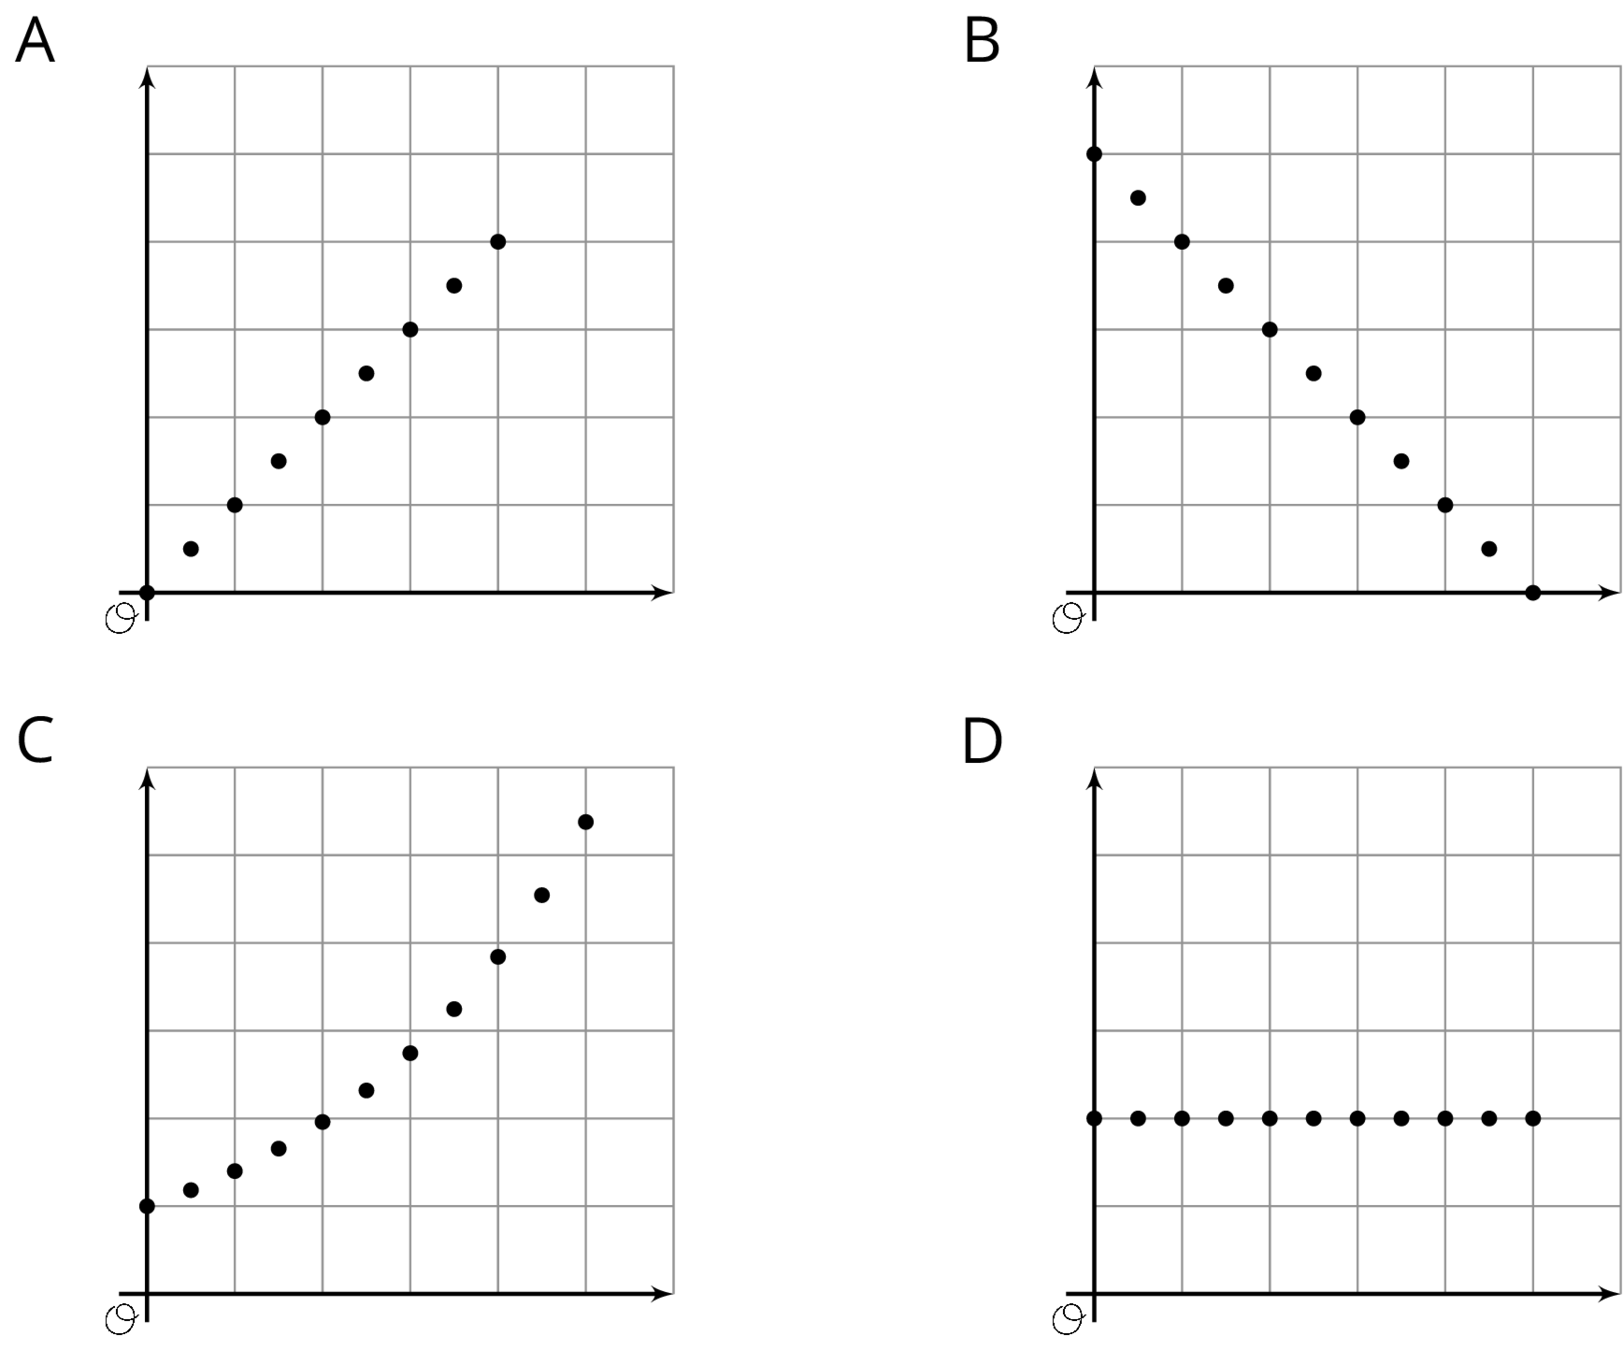
18.1: Which One Doesn’t Belong: Graphs
Which one doesn’t belong?
Let’s use graphs and equations to show relationships involving area, volume, and exponents.
Mai is creating a rectangular banner to advertise the school play. The material for the banner is sold by the square foot. Mai has enough money to buy 36 square feet of material. She is trying to decide on the length and width of the banner.
If the length is 6 feet, what is the width?
If the length is 4 feet, what is the width?
If the length is 9 feet, what is the width?
To find different combinations of length and width that give an area of 36 square feet, Mai uses the equation $w=\frac{36}{\ell}$, where $w$ is the width and $\ell$ is the length. Compare your strategy and Mai's method for finding the width. How were they alike or different?
Use several combinations of length and width to create a graph that shows the relationship between the side lengths of various rectangles with area 36 square feet.
A cereal manufacturer needs to design a cereal box that has a volume of 225 cubic inches and a height that is no more than 15 inches.
| height (in) | 5 | 9 | 12 | 7$\frac12$ | ||
|---|---|---|---|---|---|---|
| area of base (in2) | 75 | 15 |
Plot the ordered pairs from the table on the graph to show the relationship between the area of the base and the height for different boxes box with volume 225 in3.
A researcher who is studying mosquito populations collects the following data:
| row 1 | day in the study $(d)$ |
number of mosquitoes $(n)$ |
|---|---|---|
| row 2 | 1 | 2 |
| row 3 | 2 | 4 |
| row 4 | 3 | 8 |
| row 5 | 4 | 16 |
| row 6 | 5 | 32 |
The researcher said that, for these five days, the number of mosquitoes, $n$, can be found with the equation $n = 2^d$ where $d$ is the day in the study. Explain why this equation matches the data.
Use the ordered pairs in the table to graph the relationship between number of mosquitoes and day in the study for these five days.
Describe the graph. Compare how the data, equation, and graph illustrate the relationship between the day in the study and the number of mosquitoes.
If the pattern continues, how many mosquitoes will there be on day 6?
Equations can represent relationships between geometric quantities. For instance:
$$A = s^2$$
$$P = 20 + 2w$$
Here is another example of an equation with exponent expressing the relationship between quantities:
A super ball is dropped from 10 feet. On each successive bounce, it only goes $\frac{1}{2}$ as high as on the previous bounce.
This means that on the first bounce, the ball will bounce 5 feet high, and then on the second bounce it will only go $2\frac{1}{2}$ feet high, and so on. We can represent this situation with an equation to find how high the super ball will bounce after any number of bounces.
To find how high the super ball bounces on the $n^{\rm th}$ bounce, we have to multiply 10 feet (the intial height) by $\frac{1}{2}$ and multiply by $\frac{1}{2}$ again for each bounce thereafter; we need to do this $n$ times. So the height, $h$, of the ball on the $n^{\rm th}$ bounce will be $$h =10\left(\frac{1}{2}\right)^n$$ In this equation, the dependent variable, $h$, is affected by changes in the independent variable, $n$.
Equations and graphs can give us insight into different kinds of relationships between quantities and help us answer questions and solve problems.