13.1: Unlabeled Points
Label each point on the coordinate plane with the appropriate letter and ordered pair.
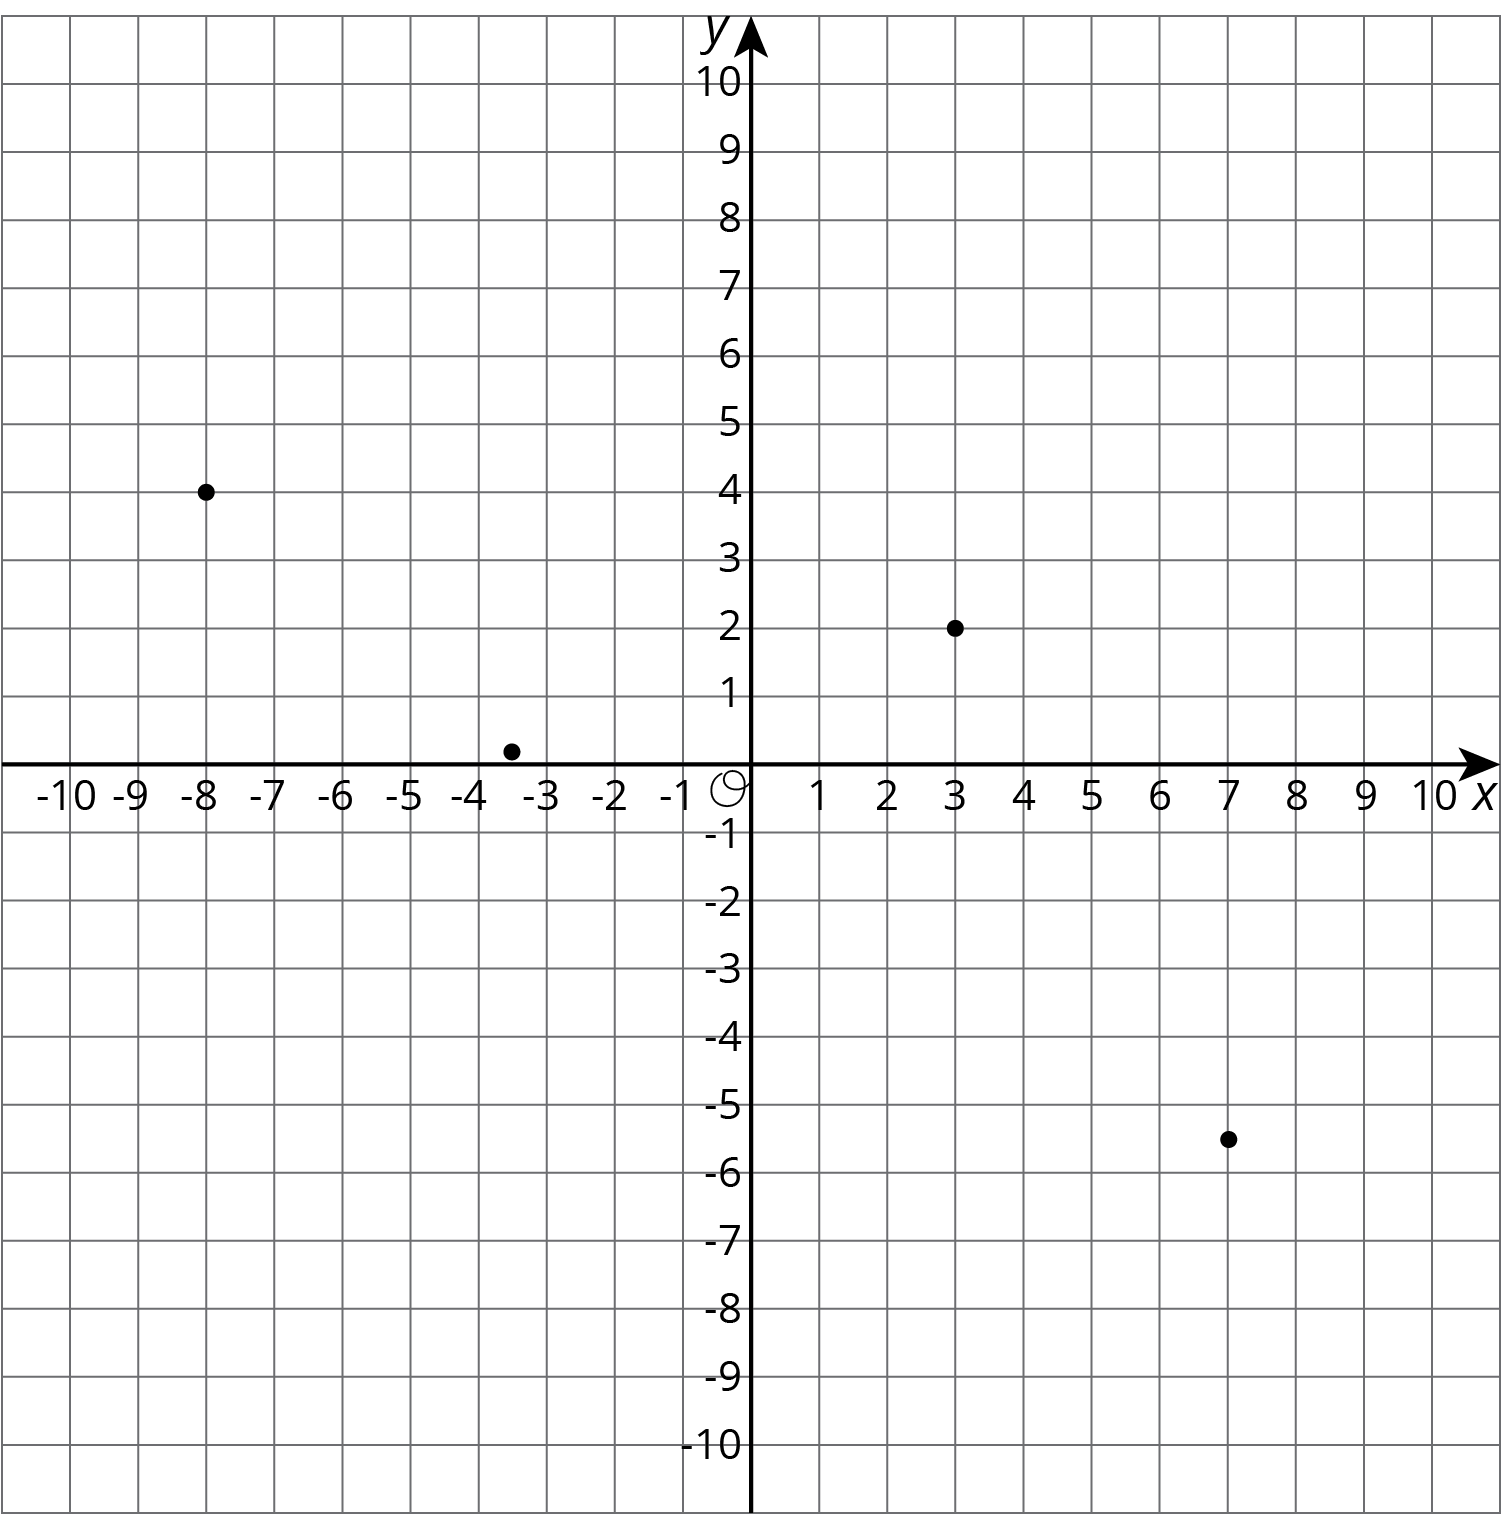
$A = (7, \text-5.5)$
$B = (\text-8, 4)$
$C = (3, 2)$
$D = (\text-3.5, 0.2)$
Let’s examine what points on the coordinate plane can tell us.
Label each point on the coordinate plane with the appropriate letter and ordered pair.
$A = (7, \text-5.5)$
$B = (\text-8, 4)$
$C = (3, 2)$
$D = (\text-3.5, 0.2)$
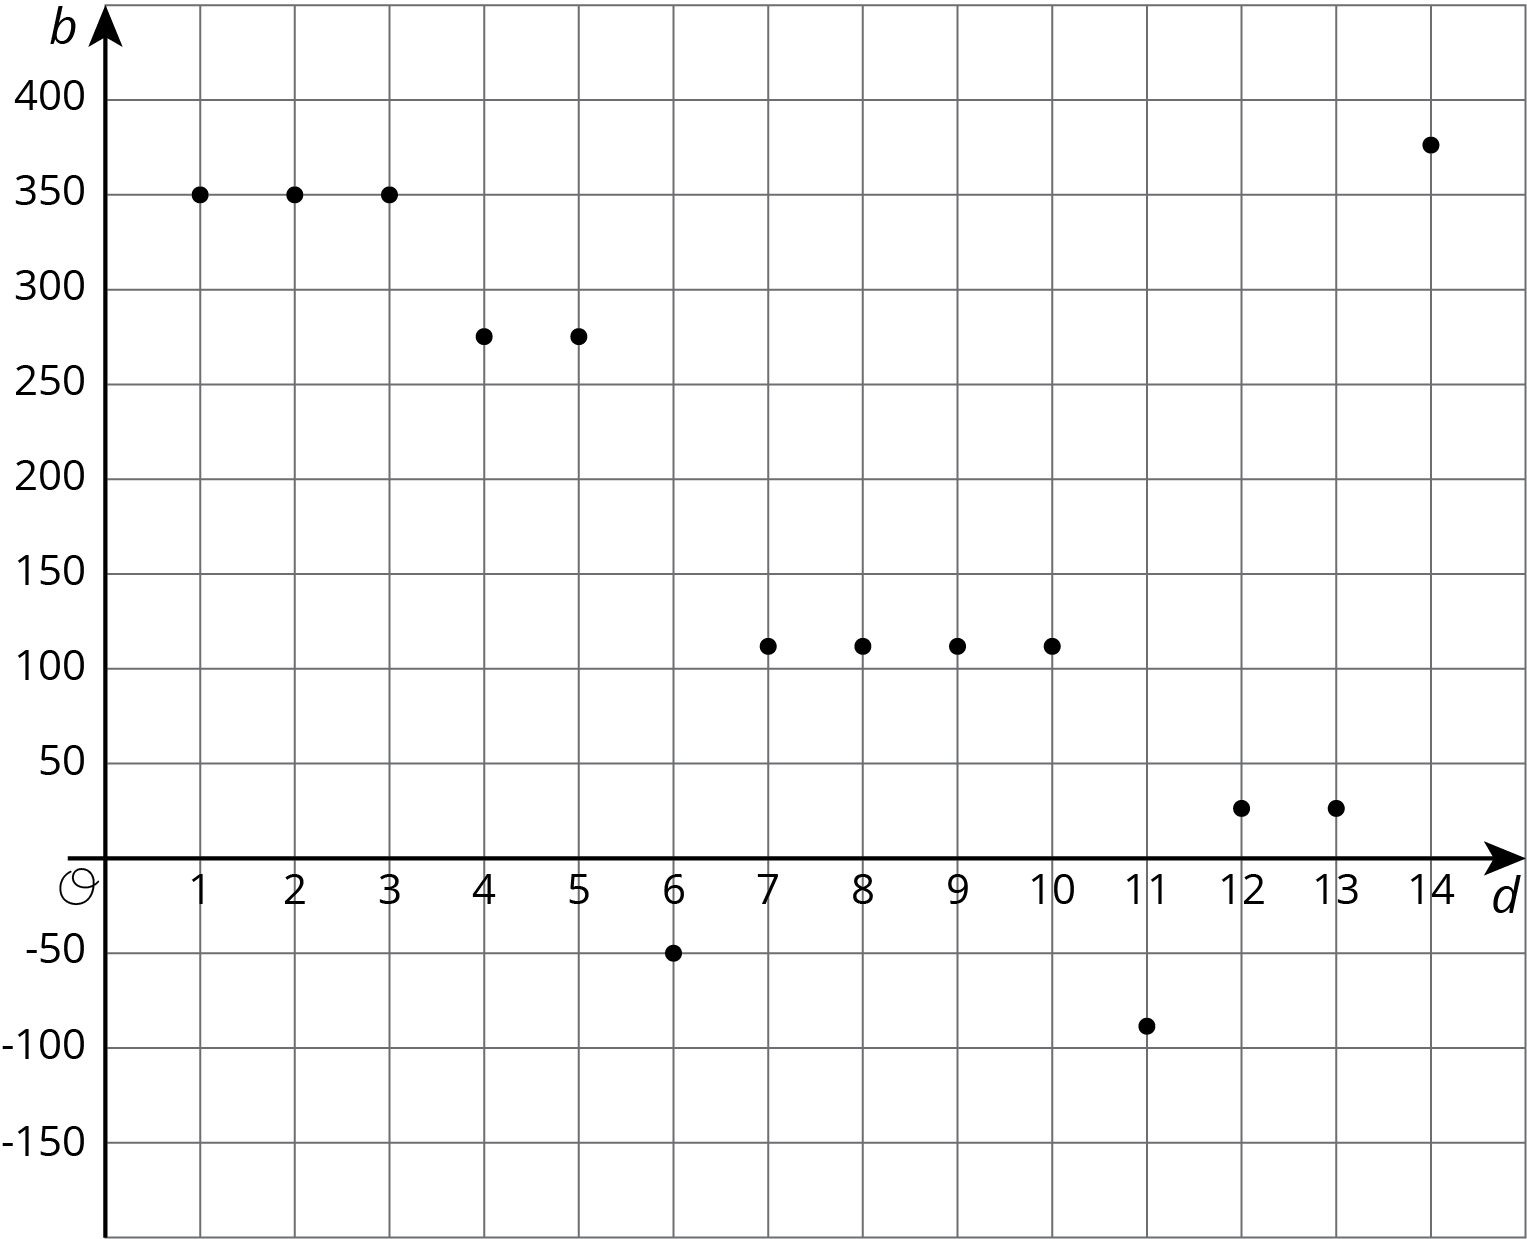
The graph shows the balance in a bank account over a period of 14 days. The axis labeled $b$ represents account balance in dollars. The axis labeled $d$ represents the day.
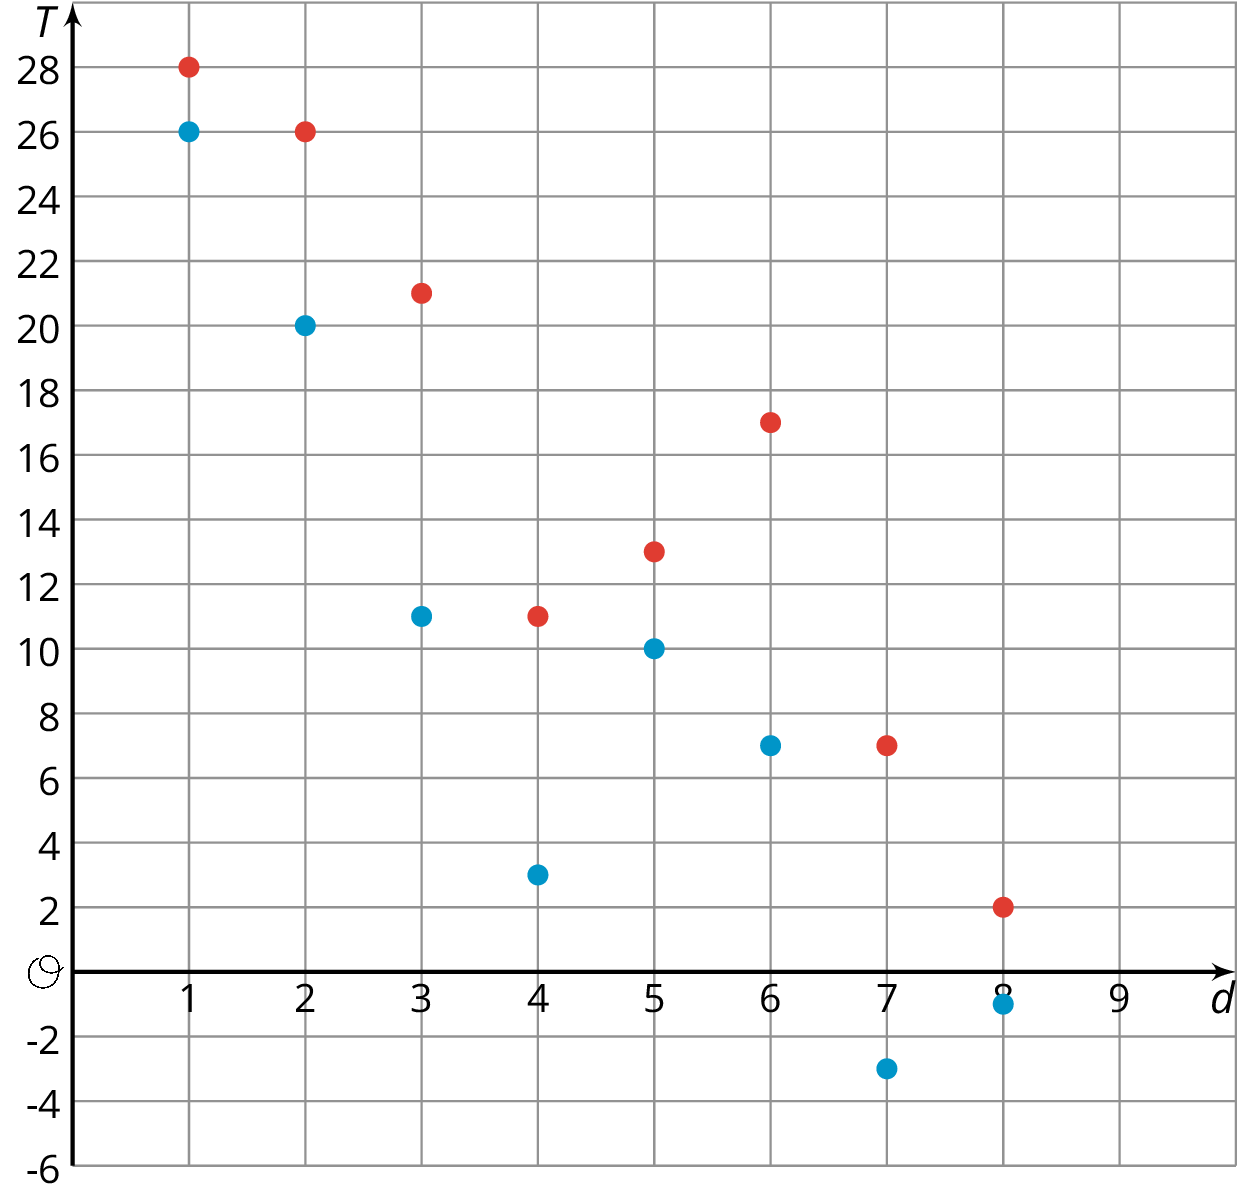
The coordinate plane shows the high and low temperatures in Nome, Alaska over a period of 8 days. The axis labeled $T$ represents temperatures in degrees Fahrenheit. The axis labeled $d$ represents the day.
Before doing this problem, do the problem about taxicab distance in an earlier lesson.
The point $(0,4)$ is 4 taxicab units away from $(\text{-}4,3)$ and 4 taxicab units away from $(2,1)$.
Points on the coordinate plane can give us information about a context or a situation. One of those contexts is about money.
To open a bank account, we have to put money into the account. The account balance is the amount of money in the account at any given time. If we put in \$350 when opening the account, then the account balance will be 350.
Sometimes we may have no money in the account and need to borrow money from the bank. In that situation, the account balance would have a negative value. If we borrow \$200, then the account balance is -200.
A coordinate grid can be used to display both the balance and the day or time for any balance. This allows to see how the balance changes over time or to compare the balances of different days.
Similarly, if we plot on the coordinate plane data such as temperature over time, we can see how temperature changes over time or compare temperatures of different times.