Lesson 12: Using Mean and MAD to Make Comparisons

Let's use mean and MAD to describe and compare distributions.

12.1: Number Talk: Decimal Division

Find the value of each expression mentally.

$42\div12$

$2.4\div12$

$44.4\div12$

$46.8\div12$

12.2: Which Player Would You Choose?

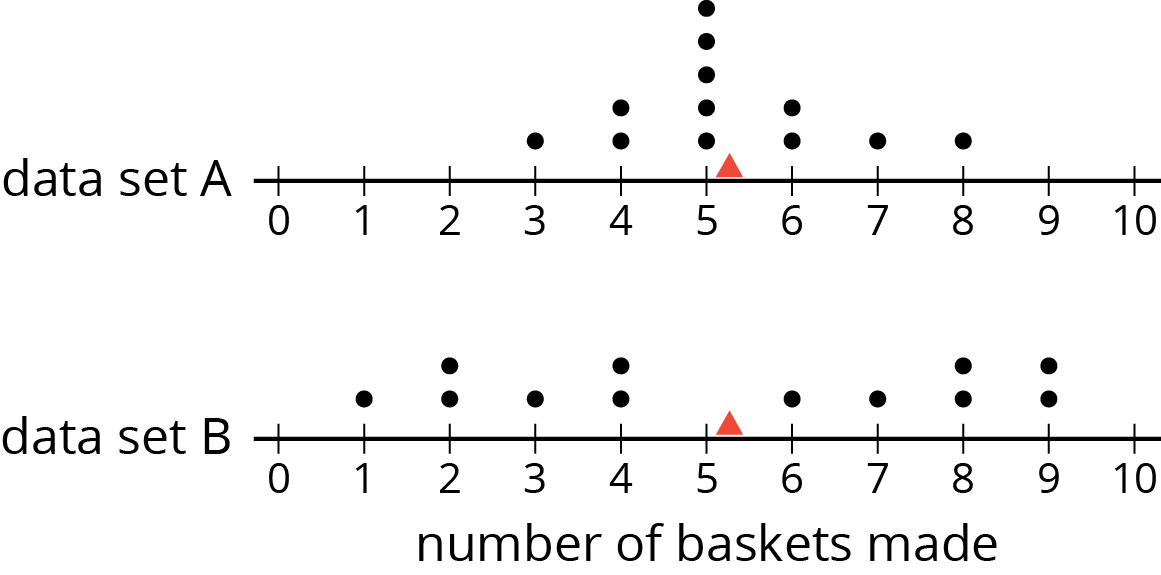
  1. Andre and Noah joined Elena, Jada, and Lin in recording their basketball scores. They all recorded their scores in the same way: the number of baskets made out of 10 attempts. Each collected 12 data points.

    Andre’s mean number of baskets was 5.25, and his MAD was 2.6. Noah’s mean number of baskets was also 5.25, but his MAD was 1.

    Here are two dot plots that represent the two data sets. The triangle indicates the location of the mean.

    Two dot plots for “number of baskets made.” The numbers 0 through 10 are indicated. On each dot plot there is a red triangle located between 5 and 6 baskets made.  The data for “data set A” are as follows: 3 baskets, 1 dot. 4 baskets, 2 dots. 5 baskets, 5 dots. 6 baskets, 2 dots. 7 baskets, 1 dot. 8 baskets, 1 dot.  The data for “data set B” are as follows: 1 basket, 1 dot. 2 baskets, 2 dots. 3 baskets, 1 dot. 4 baskets, 2 dots. 6 baskets, 1 dot. 7 baskets, 1 dot. 8 baskets, 2 dots. 9 baskets, 2 dots.
    1. Without calculating, decide which dot plot represents Andre’s data and which represents Noah’s. Explain how you know.
    2. If you were the captain of a basketball team and could use one more player on your team, would you choose Andre or Noah? Explain your reasoning.
  2. An eighth-grade student decided to join Andre and Noah and kept track of his scores. His data set is shown here. The mean number of baskets he made is 6.
    eighth‐grade student 6 5 4 7 6 5 7 8 5 6 5 8
    distance from 6                        
    1. Calculate the MAD. Show your reasoning.
    2. Draw a dot plot to represent his data and mark the location of the mean with a triangle ($\Delta$).
    3. Compare the eighth-grade student’s mean and MAD to Noah’s mean and MAD. What do you notice?
    4. Compare their dot plots. What do you notice about the distributions?
    5. What can you say about the two players’ shooting accuracy and consistency?

12.3: Swimmers Over the Years

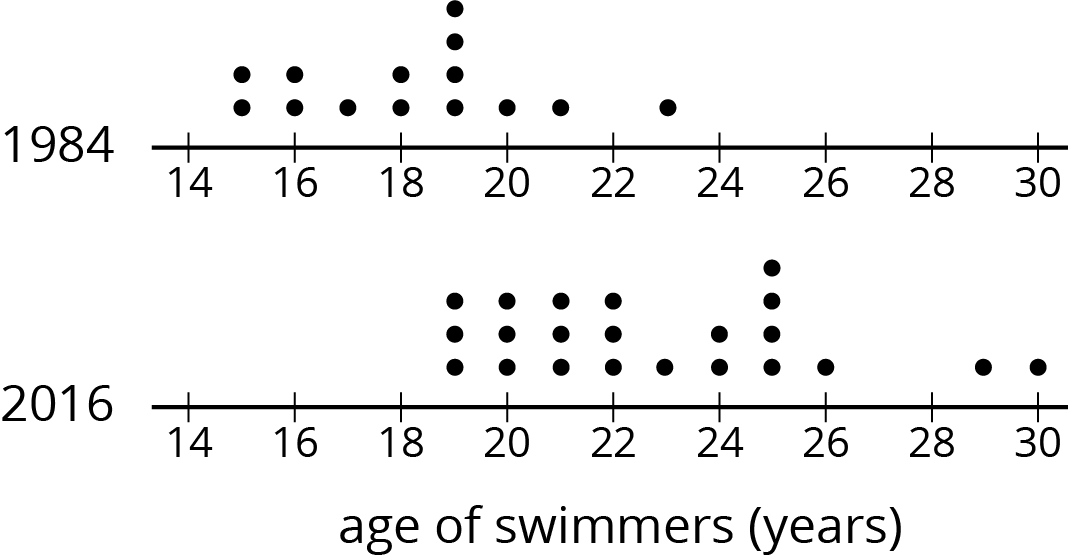
In 1984, the mean age of swimmers on the U.S. women’s swimming team was 18.2 years and the MAD was 2.2 years. In 2016, the mean age of the swimmers was 22.8 years, and the MAD was 3 years.

  1. How has the average age of the women on the U.S. swimming team changed from 1984 to 2016? Explain your reasoning.
  2. Are the swimmers on the 1984 team closer in age to one another than the swimmers on the 2016 team are to one another? Explain your reasoning.
  3. Here are dot plots showing the ages of the women on the U.S. swimming team in 1984 and in 2016. Use them to make two other comments about how the women’s swimming team has changed over the years.

    Two dot plots labeled “age of swimmers, in years" each have the numbers 14 through 30, in increments of 2, indicated. The top dot plot is for 1984 and the bottom dot plot is for 2016.  The data for 1984 is as follows.  14 years, 0 dots 15 years, 2 dots 16 years, 2 dots 17 years,1 dot 18 years, 2 dots 19 years, 4 dots 20 years, 1 dot 21 years, 1 dot 22 years, 0 dots 23 years, 1 dot 24 years, 0 dots 25 years, 0 dots 26 years, 0 dots 27 years, 0 dots 28 years, 0 dots 29 years, 0 dots 30 years, 0 dots  The data for 2016 is as follows.  14 years, 0 dots 15 years, 0 dots 16 years, 0 dots 17 years, 0 dots 18 years, 0 dots 19 years, 3 dots 20 years, 3 dots 21 years, 3 dots 22 years, 3 dots 23 years, 1 dot 24 years, 2 dots 25 years, 4 dots 26 years, 1 dot 27 years, 0 dots 28 years, 0 dots 29 years, 1 dot 30 years, 1 dot

Summary

Sometimes two distributions have different means but the same MAD.

Pugs and beagles are two different dog breeds. The dot plot shows two sets of weight data—one for pugs and the other for beagles.

A dot plot for two sets of data: "pug weights in kilograms" and "beagle weights in kilograms". The numbers 6 through 11 are indicated and there are tick marks midway between each indicated number. There are also two triangles indicated. The first triangle is at 7 kilograms with a horizontal line drawn below the triangle that begins at 6.5 and ends at 7.5 kilograms. The second triangle is indicated at 10 kilograms with a horizontal line drawn below the triangle that begins at 9.5 and ends at 10.5 kilograms.  The data for "pug weights in kilograms" are as follows: 6 kilograms, 1 dot. 6.2 kilograms, 2 dots. 6.4 kilograms, 2 dots. 6.6 kilograms, 2 dots. 6.8 kilograms, 2 dots. 7 kilograms, 3 dots. 7.2 kilograms, 3 dots. 7.4 kilograms, 1 dot. 7.6 kilograms, 2 dots. 7.8 kilograms, 1 dot. 8 kilograms, 1 dot. The data for "beagle weights in kilograms" are as follows: 9 kilograms, 1 x. 9.2 kilograms, 2 x's. 9.4 kilograms, 1 x. 9.6 kilograms, 3 x's. 9.8 kilograms, 1 x. 10 kilograms, 3 x's. 10.2 kilograms, 3 x's. 10.4 kilograms, 1 x. 10.6 kilograms, 2 x's. 10.8 kilograms, 2 x's. 11 kilograms, 1 x.

  • The mean weight for pugs is 7 kilograms, and the MAD is 0.5 kilogram.
  • The mean weight for beagles is 10 kilograms, and the MAD is 0.5 kilogram.

We can say that, in general, the beagles are heavier than the pugs. A typical weight for the beagles in this group is about 3 kilograms heavier than a typical weight for the pugs.

The variability of pug weights, however, is about the same as the variability of beagle weights. In other words, the weights of pugs and the weights of beagles are equally spread out.

Practice Problems ▶