Lesson 2: Using Diagrams to Represent Addition and Subtraction

Let’s represent addition and subtraction of decimals.

2.1: Changing Values

  1. Here is a rectangle.
    A rectangle divided vertically into 10 equal squares.

    What number does the rectangle represent if each small square represents:

    1. 1

    1. 0.1

    1. 0.01

    1. 0.001

  2. Here is a square.
    A square divided horizontally into 10 equal rectangles.

    What number does the square represent if each small rectangle represents:

    1. 10
    2. 0.1
    3. 0.00001

2.2: Squares and Rectangles

You may be familiar with base-ten blocks that represent ones, tens, and hundreds. Here are some diagrams that we will use to represent digital base-ten units. A large square represents 1 one. A rectangle represents 1 tenth. A small square represents 1 hundredth. 

The applet has tools that create each of the base-ten blocks. 

Select a Block tool, and then click on the screen to place it.

One


Tenth


Hundredth

Click on the Move tool when you are done choosing blocks.

GeoGebra Applet FXEZD466

  1. Here is the diagram that Priya drew to represent 0.13. Draw a different diagram that represents 0.13. Explain why your diagram and Priya’s diagram represent the same number.

  2. Here is the diagram that Han drew to represent 0.25. Draw a different diagram that represents 0.25. Explain why your diagram and Han’s diagram represent the same number.

  3. For each of these numbers, draw or describe two different diagrams that represent it.

    a. 0.1                                            b. 0.02                                             c. 0.43
  4. Use diagrams of base-ten units to represent the following sums and find their values. Think about how you could use as few units as possible to represent each number.

    1. $0.03 + 0.05$

    2. $0.06 + 0.07$

    3. $0.4 + 0.7$

2.3: Finding Sums in Different Ways

  1. Here are two ways to calculate the value of $0.26 + 0.07$. In the diagram, each rectangle represents 0.1 and each square represents 0.01.

    A diagram of two strategies used to calculate an expression. The strategy on the left is a vertical equation of 0 point 2 6 plus 0 point 0 7 results in 0 point 3 3. A 1 is written above the tenths column.  The strategy on the right is of a base-ten diagram. There are 2 large rectangles and 6 small squares indicated. Directly below, the squares are an additional 7 small squares indicated. A dashed circle contains 10 of the small squares with an arrow labeled bundle pointing to a third large rectangle. The third rectangle is drawn under the other two existing large rectangles.

    Use what you know about base-ten units and addition of base-ten numbers to explain:

    1. Why ten squares can be “bundled” into a rectangle.

    2. How this “bundling” is reflected in the computation.

    The applet has tools that create each of the base-ten blocks. Select a Block tool, and then click on the screen to place it.

    One


    Tenth


    Hundredth

    Click on the Move tool when you are done choosing blocks.

    GeoGebra Applet WfP5JSmE

  2. Find the value of $0.38 + 0.69$ by drawing a diagram. Can you find the sum without bundling? Would it be useful to bundle some pieces? Explain your reasoning.

  3. Calculate $0.38 + 0.69$. Check your calculation against your diagram in the previous question.

  4. Find each sum. The larger square represents 1, the rectangle represents 0.1, and the smaller square represents 0.01.

2.4: Representing Subtraction

Here are the diagrams you used to represent ones, tenths, hundredths, thousandths, and ten-thousandths.

A diagram of base-ten units: 1 large square labeled "one.” 1 medium rectangle labeled “zero point one, or tenth.” 1 medium square labeled “ 0 point 0 one, or hundredth.” 1 tiny rectangle labeled “0 point 0 0 1, or thousandth.” 1 tiny square labeled “0 point 0 0 0 1, or ten-thousandth.”
  1. Here are diagrams that represent differences. Removed pieces are marked with Xs. For each diagram, write a numerical subtraction expression and determine the value of the expression.


  2. Express each subtraction in words.

    1. $0.05 - 0.02$

    2. $0.024 - 0.003$

    3. $1.26 - 0.14$

  3. Find each difference by drawing a diagram and by calculating with numbers. Make sure the answers from both methods match. If not, check your diagram and your numerical calculation.

    1. $0.05 - 0.02$
    2. $0.024 - 0.003$
    3. $1.26 - 0.14$

Summary

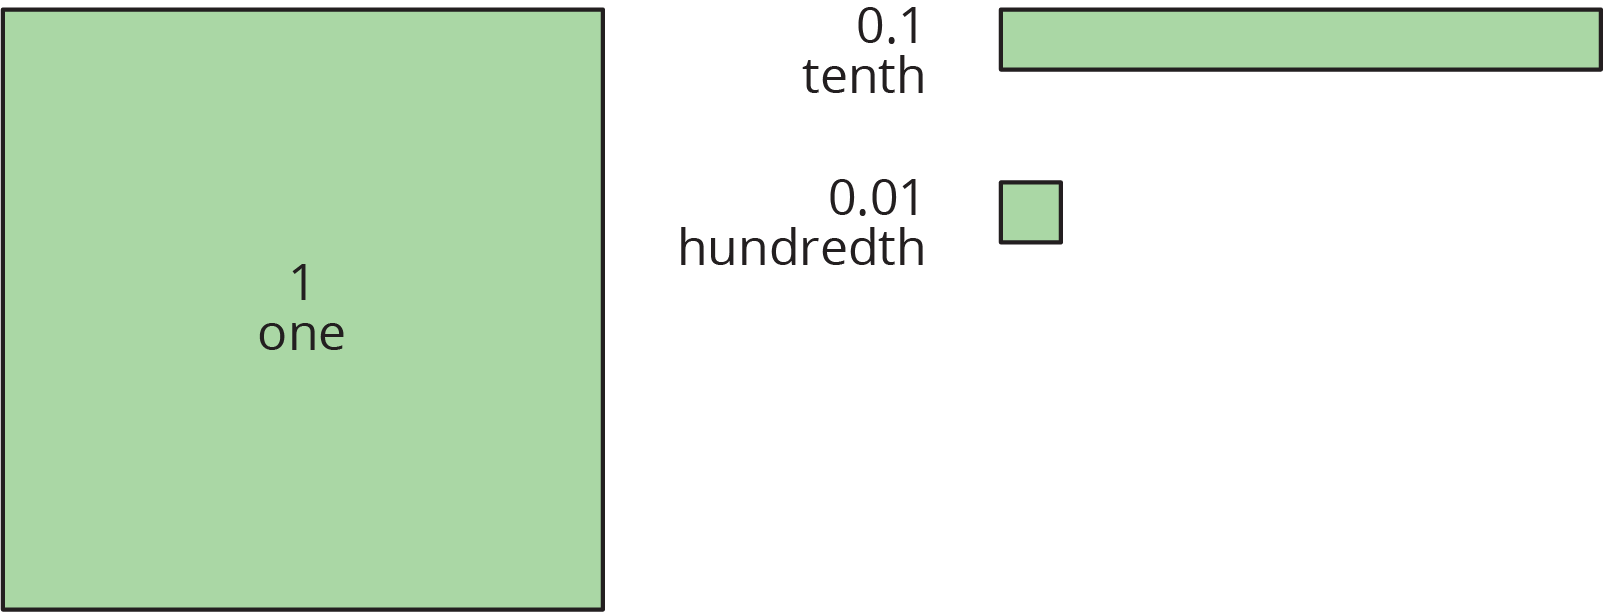
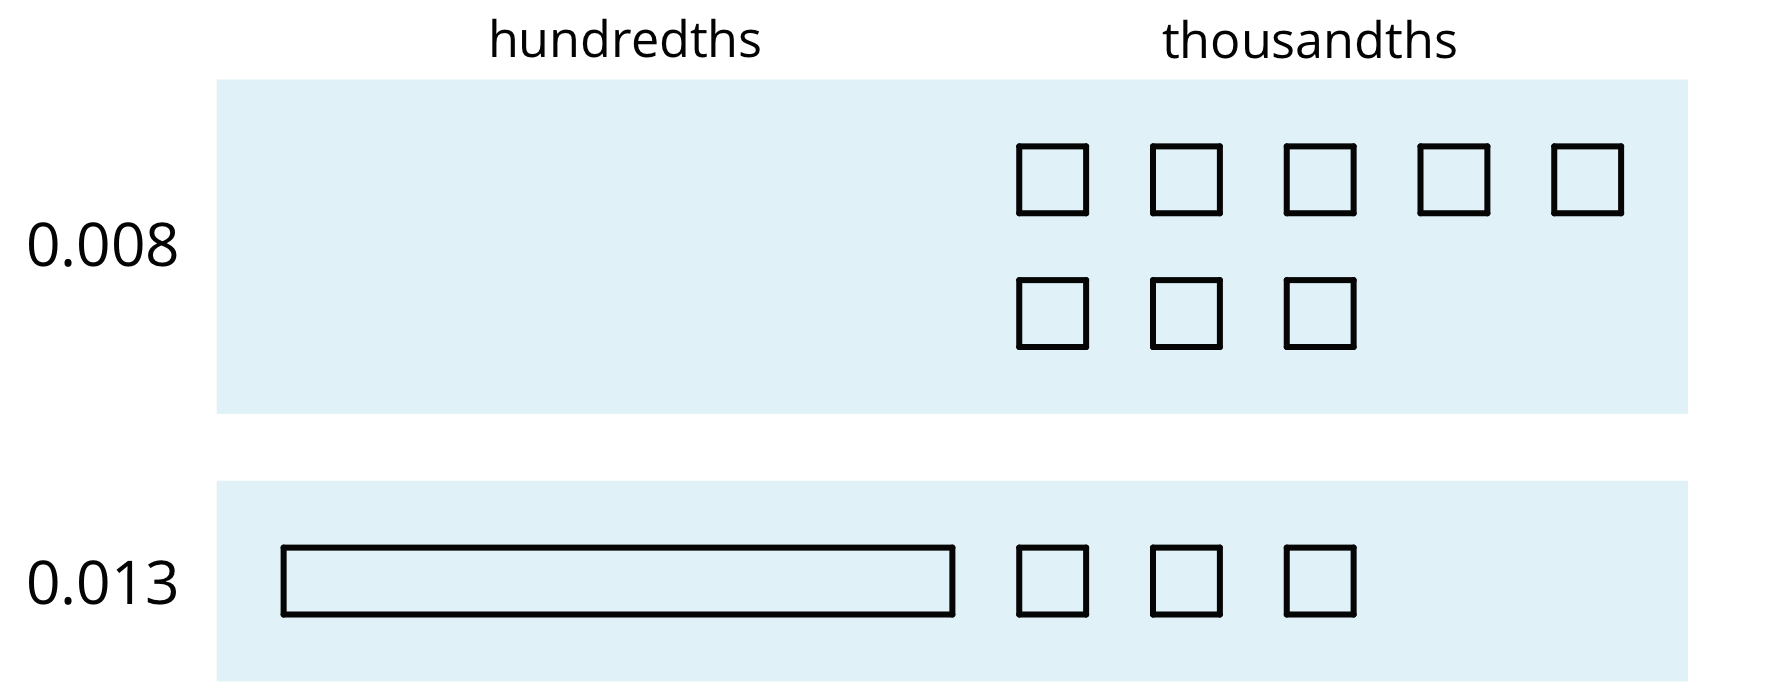
Base-ten diagrams represent collections of base-ten units—tens, ones, tenths, hundredths, etc. We can use them to help us understand sums of decimals.

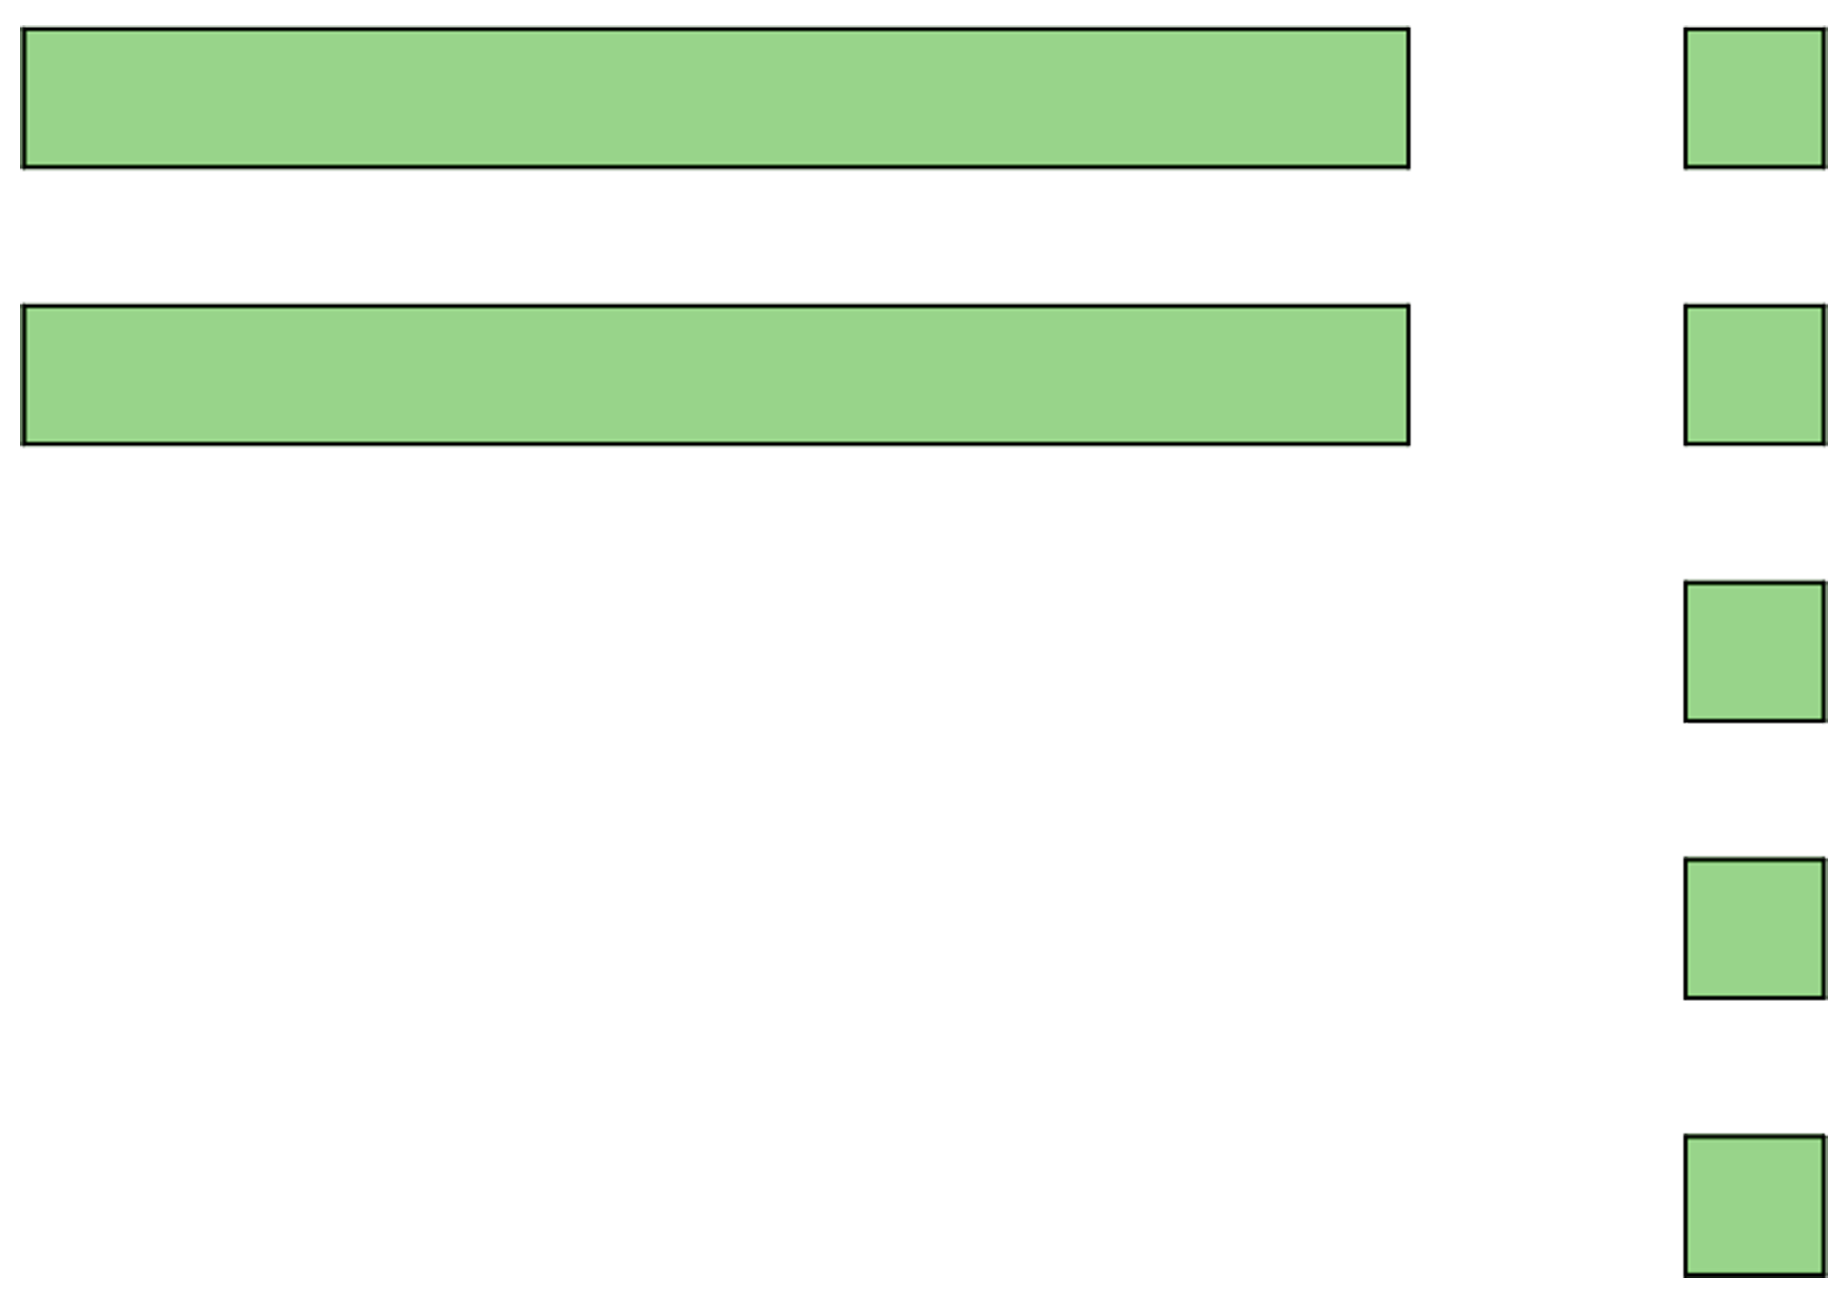
Here is a diagram of 0.008 and 0.013, where a square represents 0.001 and a rectangle (made up of ten squares) represents 0.01.
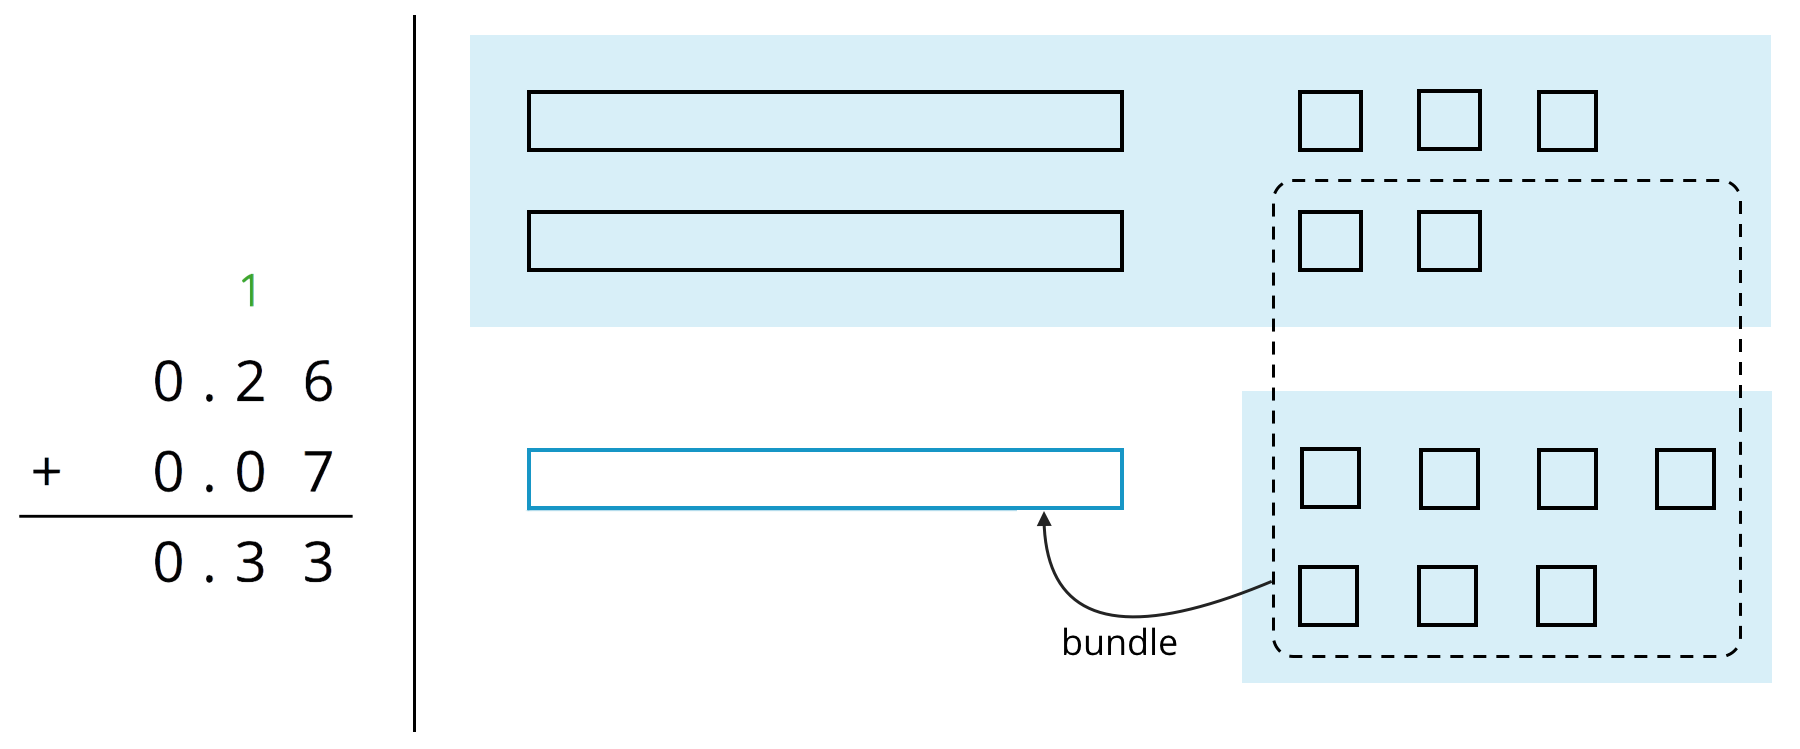
To find the sum, we can “bundle (or compose) 10 thousandths as 1 hundredth. 

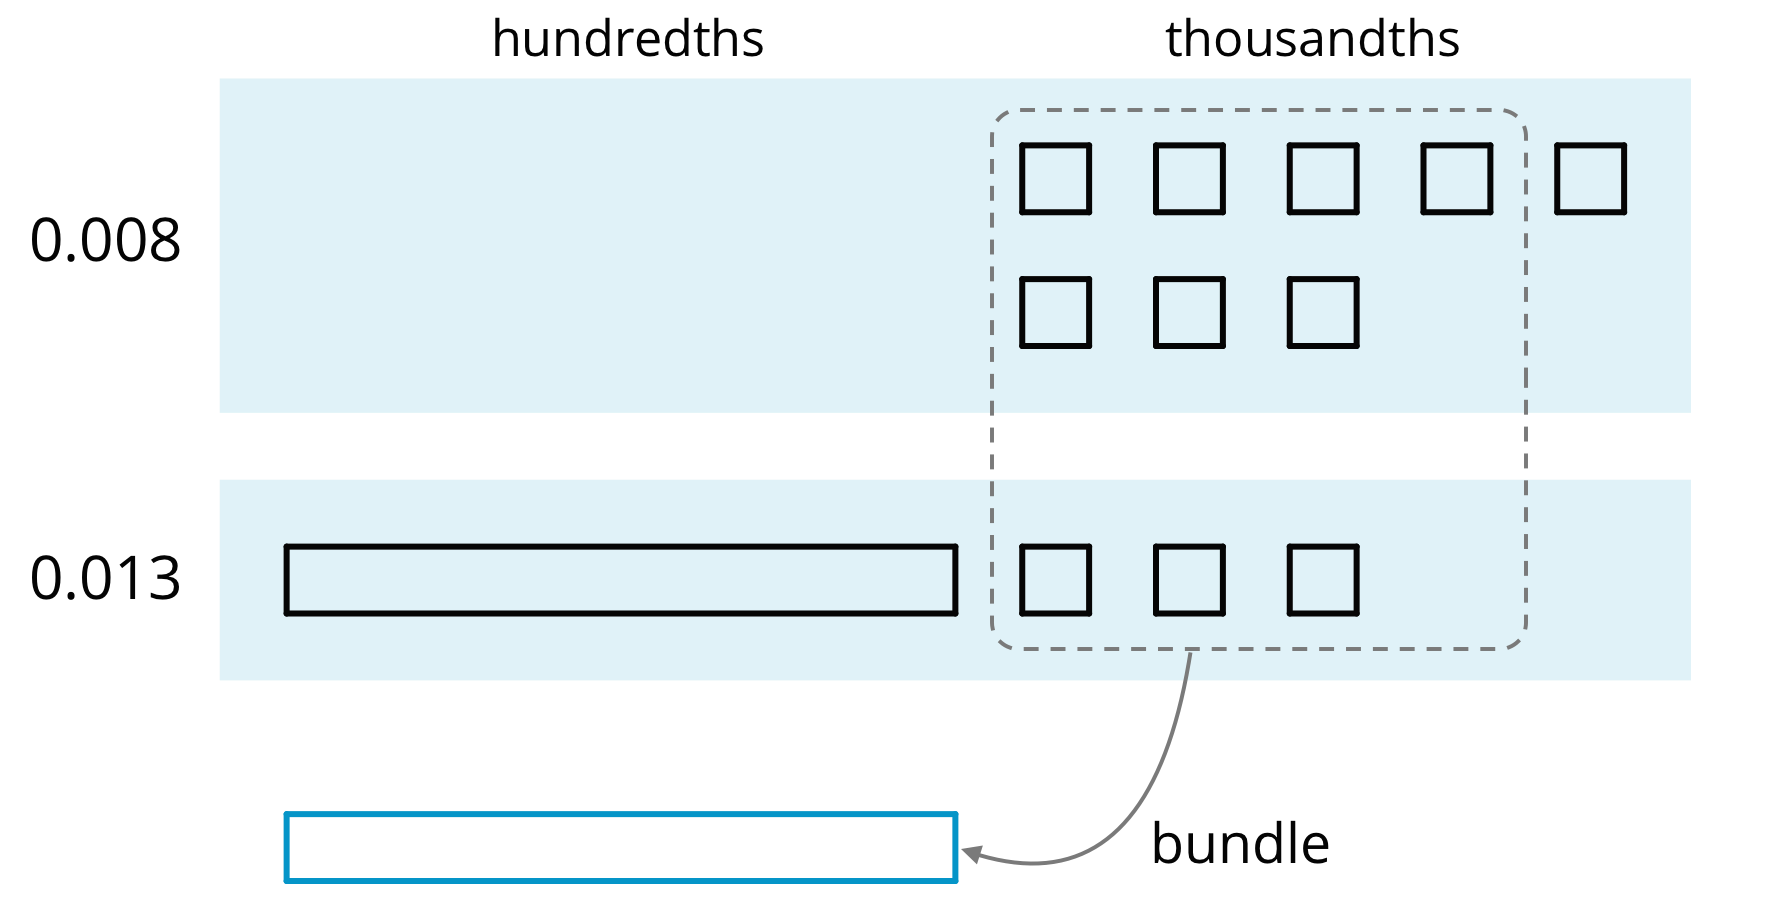
Here is a diagram of the sum, which shows 2 hundredths and 1 thousandth.

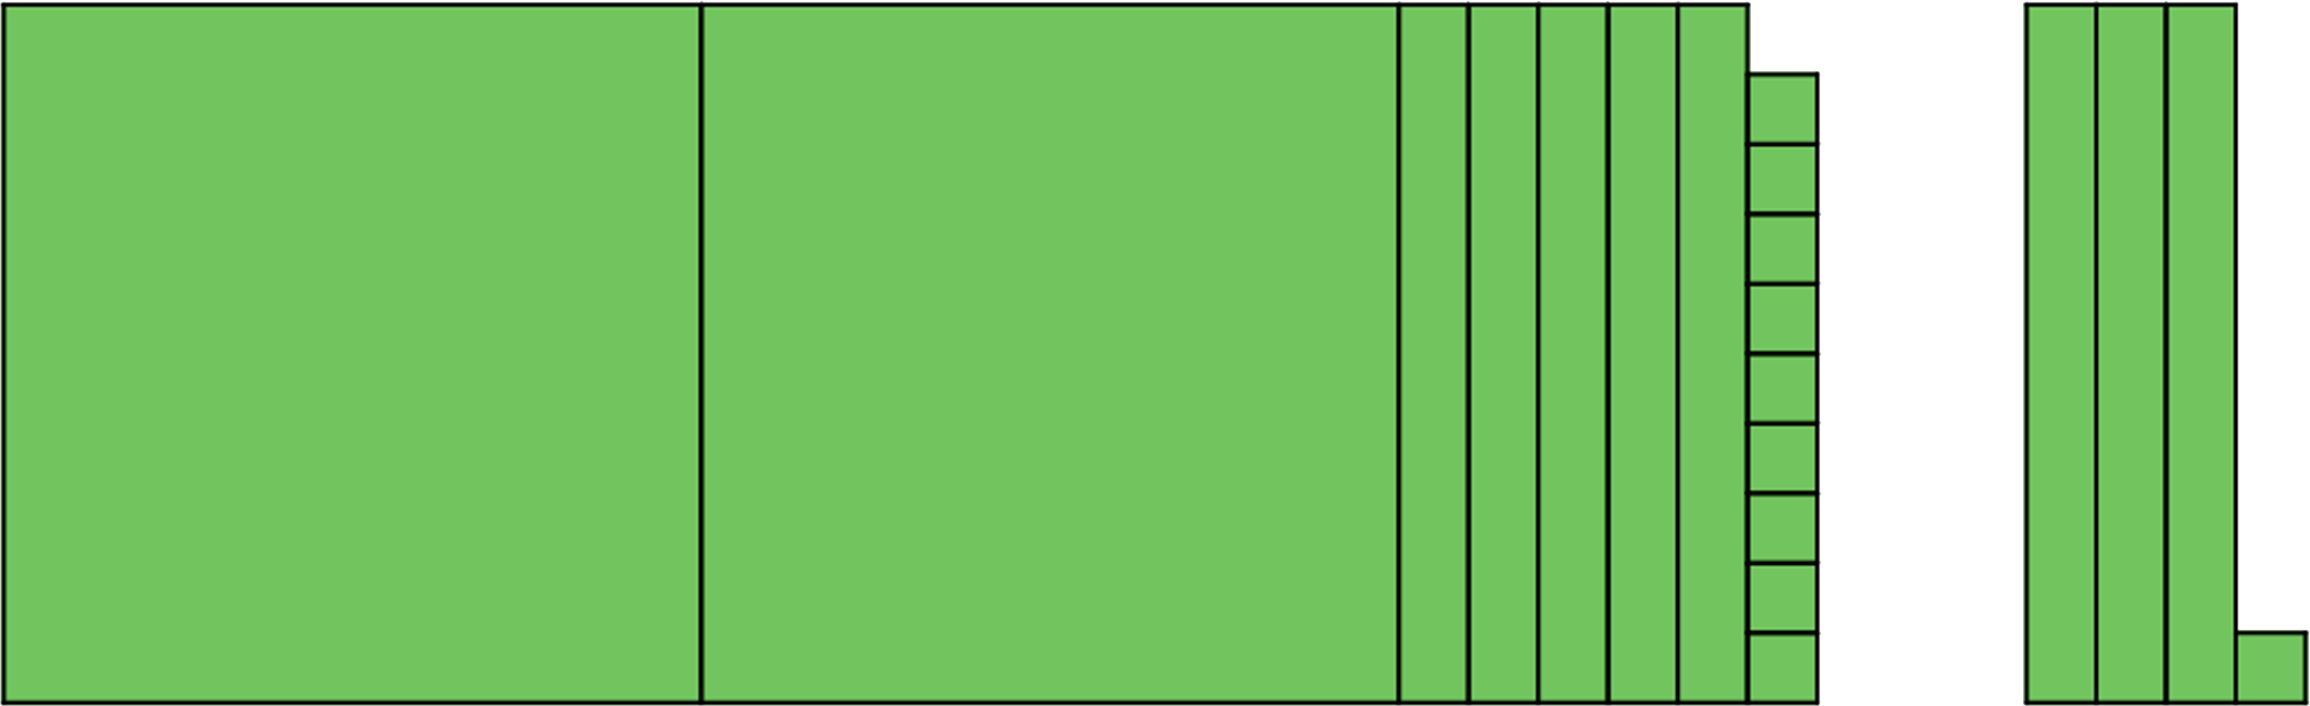
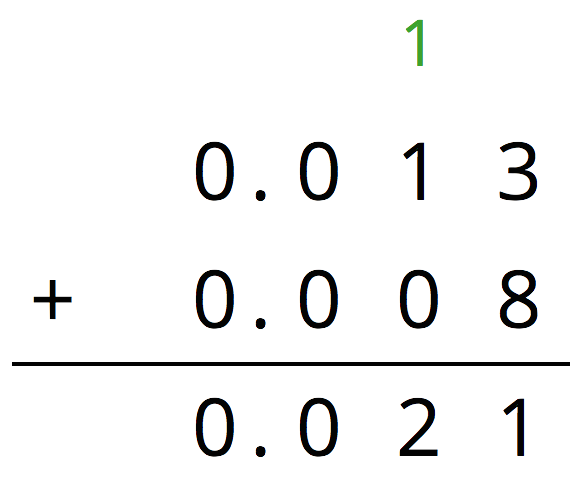
We can use vertical calculation to find $0.008 + 0.013$. Notice that here 10 thousandths are also bundled (or composed) as 1 hundredth.

Practice Problems ▶