Lesson 9: Interpreting the Mean as Fair Share

Let’s explore the mean of a data set and what it tells us.

9.1: Close to Four

Use the digits 0–9 to write an expression with a value as close as possible to 4. Each digit can be used only one time in the expression.

$$\left(\boxed{\phantom{TEST}}+ \boxed{\phantom{TEST}}+ \boxed{\phantom{TEST}}+ \boxed{\phantom{TEST}} \right) \div 4$$

9.2: Spread Out and Share

  1. The kittens in a room at an animal shelter are arranged in five crates, as shown.
    A large rectangle that is divided into 5 equal squares that represent crates. There are 2 cats are in the first square, 1 cat is in the second square, 4 cats are in the third square and 3 cats in the fourth square. There are no cats are in the fifth square. Cat Clip Art Copyright Owner: Clker-Free-Vector-Images License: Public Domain Via: Pixabay
    1. The manager of the shelter wants the kittens distributed equally among the crates. How might that be done? How many kittens will end up in each crate?

    2. The number of kittens in each crate after they are equally distributed is called the mean number of kittens per crate, or the average number of kittens per crate.

      Explain how the expression $10 \div 5$ is related to the average.

    3. A different room in the shelter has 6 crates. No two crates contain the same number of kittens, and there is an average of 3 kittens per crate.

      Draw or describe at least two different arrangements of kittens that match this description. You may choose to use the applet to help.

    GeoGebra Applet TxETsBWF

  2. Five servers were scheduled to work the number of hours shown in the table. They decided to share the workload, so each one would work equal hours.

      server A server B server C server D server E
    hours worked 3 6 11 7 4
    1. On the grid on the left, draw a bar graph that represents the hours worked by Servers A, B, C, D, and E.
    2. Think about how you would rearrange the hours so that each server gets a fair share. Then, on the grid on the right, draw a new graph to represent the rearranged hours. Be prepared to explain your reasoning.
    3. Based on your second graph, what is the average or mean number of hours that the servers will work?

    4. Explain why we can also find the mean by finding the value of $31 \div 5$.

    5. Which server will see the biggest change to work hours? Which server will see the least change?

9.3: Getting to School

  1. For the past 12 school days, Mai has recorded how long her bus rides to school take in minutes. The times she recorded are shown in the table.
    Row 1 9 8 6 9 10 7 6 12 9 8 10 8
    1. Find the mean for Mai’s data. Show your reasoning.
    2. In this situation, what does the mean tell us about Mai’s trip to school?
  2. For 5 days, Tyler has recorded how long his walks to school take in minutes. The mean for his data is 11 minutes.

    1. Without calculating, predict if each of the data sets shown could be Tyler’s. Explain your reasoning.
      data set A 11 8 7 9 8
      data set B 12 7 13 9 14
      data set C 11 20 6 9 10
      data set D 8 10 9 11 11
    2. Determine which data set is Tyler’s. Explain how you know.

Summary

Sometimes a general description of a distribution does not give enough information, and a more precise way to talk about center or spread would be more useful. The mean, or average, is a number we can use to summarize a distribution.

We can think about the mean in terms of “fair share” or “leveling out.” That is, a mean can be thought of as a number that each member of a group would have if all the data values were combined and distributed equally among the members.

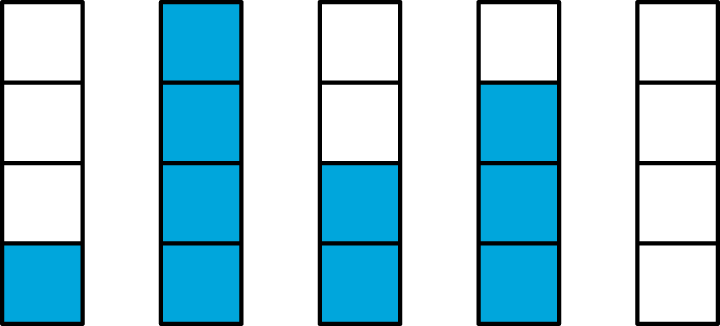
The table and diagram show how many liters of water are in each of five bottles.

1 4 2 3 0
There are 5 identical tape diagrams that are each partitioned into 4 equal parts. The first diagram has 1 part shaded. The second diagram has 4 parts shaded. The third diagram has 2 parts shaded. The fourth diagram has 3 parts shaded. The fifth diagram has no parts shaded.

To find the mean, first we add up all of the values, which we can think of as putting all of the water together: $1+4+2+3+0=10$.

A tape diagram partitioned into 10 equal parts. All 10 parts are shaded.

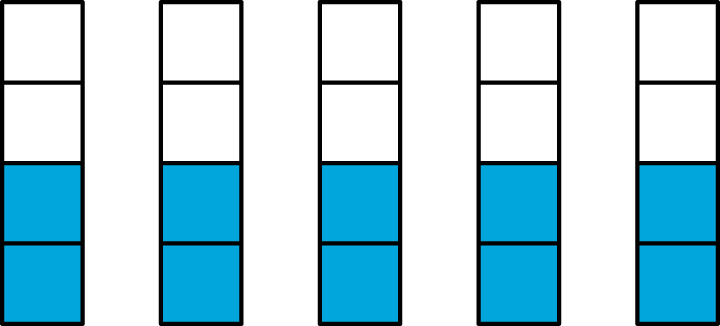
To find the “fair share,” we divide the 10 liters equally into the 5 containers: $10\div 5 = 2$.

There are 5 identical tape diagrams each partitioned into 4 equal parts. Each diagram has 2 parts shaded.

Suppose the quiz scores of a student are 70, 90, 86, and 94. We can find the mean (or average) score by finding the sum of the scores $(70+90+86+94=340)$ and dividing the sum by four $(340 \div 4 = 85)$. We can then say that the student scored, on average, 85 points on the quizzes. 

In general, to find the mean of a data set with $n$ values, we add all of the values and divide the sum by $n$.

Practice Problems ▶

Glossary

mean

mean

The mean, or average, of a data set is the value you get by adding up all of the values in the set and dividing by the number of values in the set.

average

average

The average, or mean, of a data set is the value you get by adding up all of the values in the set and dividing by the number of values in the set.